Japanese vs Icelander Associate's Degree
COMPARE
Japanese
Icelander
Associate's Degree
Associate's Degree Comparison
Japanese
Icelanders
41.7%
ASSOCIATE'S DEGREE
0.5/ 100
METRIC RATING
258th/ 347
METRIC RANK
48.3%
ASSOCIATE'S DEGREE
90.8/ 100
METRIC RATING
131st/ 347
METRIC RANK
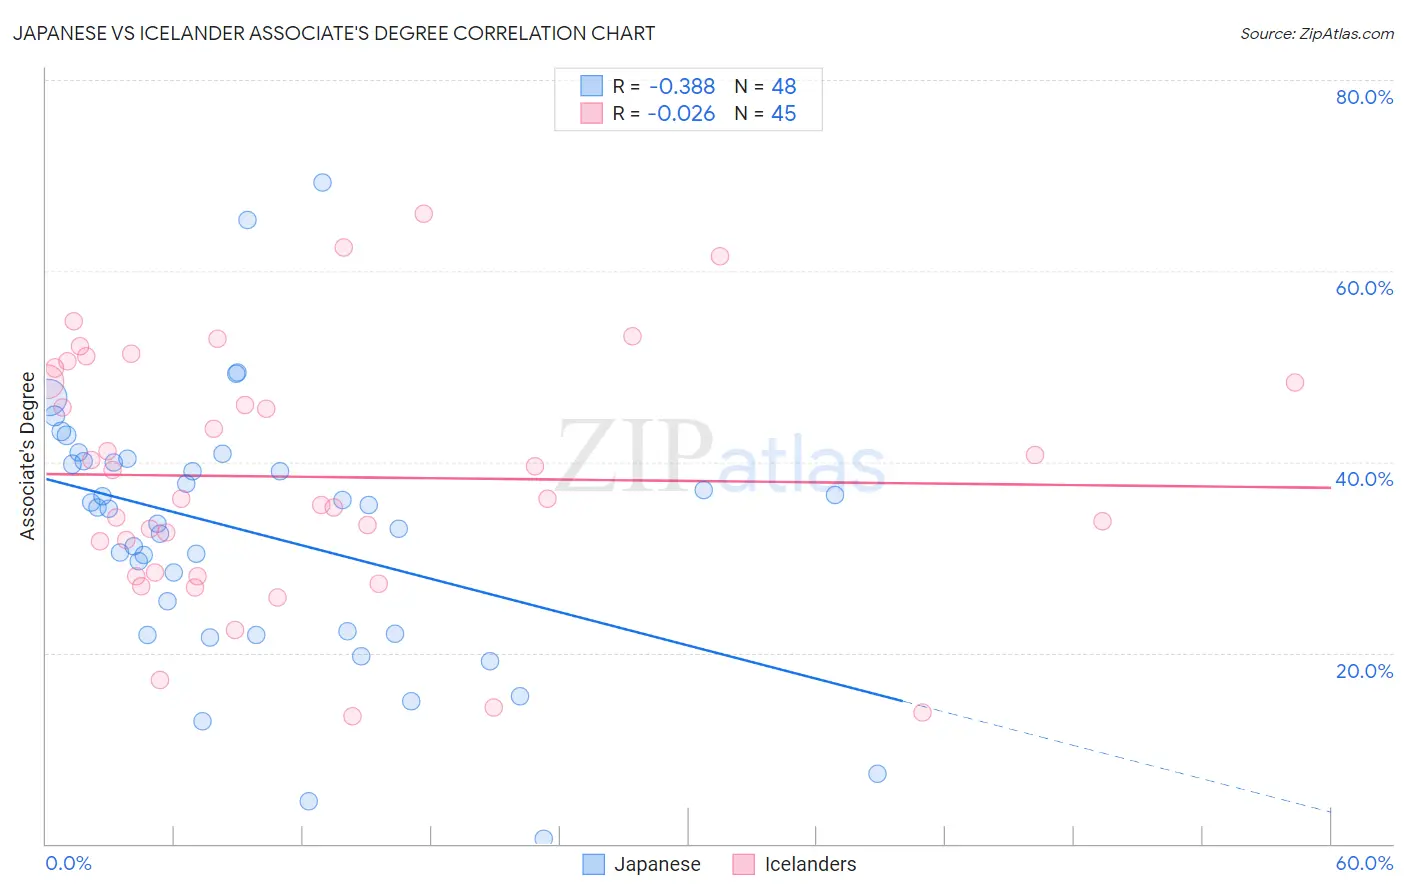
Japanese vs Icelander Associate's Degree Correlation Chart
The statistical analysis conducted on geographies consisting of 249,174,886 people shows a mild negative correlation between the proportion of Japanese and percentage of population with at least associate's degree education in the United States with a correlation coefficient (R) of -0.388 and weighted average of 41.7%. Similarly, the statistical analysis conducted on geographies consisting of 159,662,338 people shows no correlation between the proportion of Icelanders and percentage of population with at least associate's degree education in the United States with a correlation coefficient (R) of -0.026 and weighted average of 48.3%, a difference of 16.0%.
Associate's Degree Correlation Summary
| Measurement | Japanese | Icelander |
| Minimum | 0.50% | 13.3% |
| Maximum | 69.2% | 66.0% |
| Range | 68.7% | 52.6% |
| Mean | 32.6% | 38.4% |
| Median | 35.1% | 36.2% |
| Interquartile 25% (IQ1) | 22.1% | 28.2% |
| Interquartile 75% (IQ3) | 40.0% | 49.1% |
| Interquartile Range (IQR) | 17.9% | 20.9% |
| Standard Deviation (Sample) | 13.5% | 13.0% |
| Standard Deviation (Population) | 13.4% | 12.8% |
Similar Demographics by Associate's Degree
Demographics Similar to Japanese by Associate's Degree
In terms of associate's degree, the demographic groups most similar to Japanese are Malaysian (41.6%, a difference of 0.10%), Spanish American (41.8%, a difference of 0.22%), Immigrants from Congo (41.8%, a difference of 0.27%), Marshallese (41.6%, a difference of 0.30%), and Immigrants from Guyana (41.8%, a difference of 0.40%).
| Demographics | Rating | Rank | Associate's Degree |
| Immigrants | Bahamas | 0.7 /100 | #251 | Tragic 42.1% |
| French American Indians | 0.6 /100 | #252 | Tragic 42.0% |
| Indonesians | 0.6 /100 | #253 | Tragic 41.9% |
| Cubans | 0.6 /100 | #254 | Tragic 41.9% |
| Immigrants | Guyana | 0.5 /100 | #255 | Tragic 41.8% |
| Immigrants | Congo | 0.5 /100 | #256 | Tragic 41.8% |
| Spanish Americans | 0.5 /100 | #257 | Tragic 41.8% |
| Japanese | 0.5 /100 | #258 | Tragic 41.7% |
| Malaysians | 0.4 /100 | #259 | Tragic 41.6% |
| Marshallese | 0.4 /100 | #260 | Tragic 41.6% |
| Nicaraguans | 0.4 /100 | #261 | Tragic 41.5% |
| Bahamians | 0.4 /100 | #262 | Tragic 41.5% |
| Immigrants | Jamaica | 0.3 /100 | #263 | Tragic 41.5% |
| Osage | 0.3 /100 | #264 | Tragic 41.5% |
| Africans | 0.2 /100 | #265 | Tragic 41.1% |
Demographics Similar to Icelanders by Associate's Degree
In terms of associate's degree, the demographic groups most similar to Icelanders are Immigrants from Jordan (48.4%, a difference of 0.10%), Swedish (48.4%, a difference of 0.16%), Immigrants from Albania (48.2%, a difference of 0.18%), Immigrants from Eastern Africa (48.4%, a difference of 0.19%), and Assyrian/Chaldean/Syriac (48.2%, a difference of 0.27%).
| Demographics | Rating | Rank | Associate's Degree |
| Serbians | 92.6 /100 | #124 | Exceptional 48.5% |
| Chinese | 92.5 /100 | #125 | Exceptional 48.5% |
| Immigrants | Syria | 92.2 /100 | #126 | Exceptional 48.5% |
| Immigrants | Uganda | 92.1 /100 | #127 | Exceptional 48.5% |
| Immigrants | Eastern Africa | 91.6 /100 | #128 | Exceptional 48.4% |
| Swedes | 91.5 /100 | #129 | Exceptional 48.4% |
| Immigrants | Jordan | 91.2 /100 | #130 | Exceptional 48.4% |
| Icelanders | 90.8 /100 | #131 | Exceptional 48.3% |
| Immigrants | Albania | 89.9 /100 | #132 | Excellent 48.2% |
| Assyrians/Chaldeans/Syriacs | 89.4 /100 | #133 | Excellent 48.2% |
| Moroccans | 89.3 /100 | #134 | Excellent 48.2% |
| Europeans | 89.0 /100 | #135 | Excellent 48.2% |
| Pakistanis | 88.0 /100 | #136 | Excellent 48.1% |
| Immigrants | Eritrea | 87.8 /100 | #137 | Excellent 48.1% |
| Poles | 87.3 /100 | #138 | Excellent 48.0% |