Iroquois vs Immigrants from Lithuania GED/Equivalency
COMPARE
Iroquois
Immigrants from Lithuania
GED/Equivalency
GED/Equivalency Comparison
Iroquois
Immigrants from Lithuania
84.6%
GED/EQUIVALENCY
7.5/ 100
METRIC RATING
222nd/ 347
METRIC RANK
88.6%
GED/EQUIVALENCY
99.8/ 100
METRIC RATING
27th/ 347
METRIC RANK
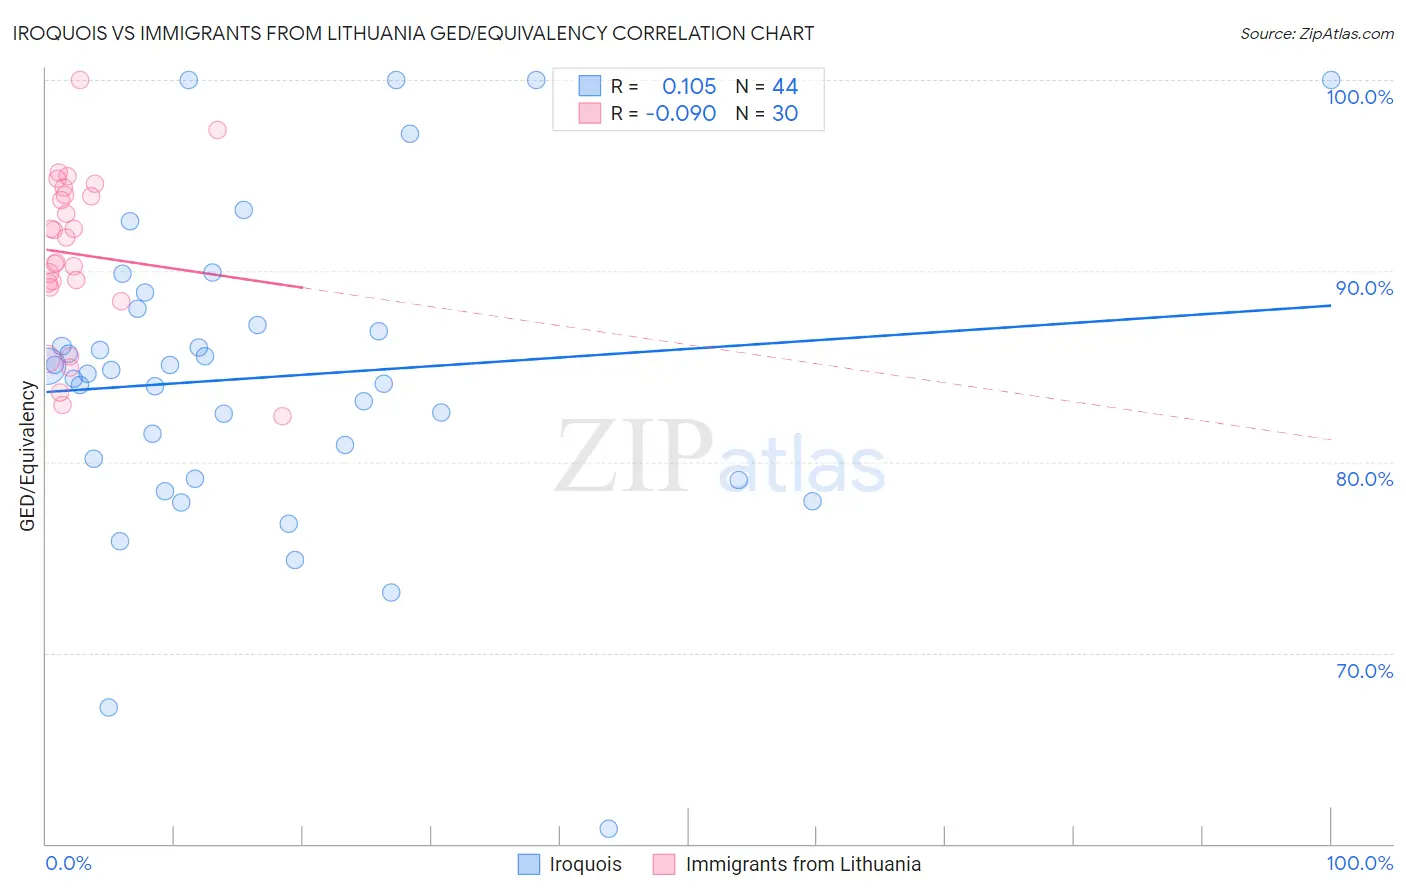
Iroquois vs Immigrants from Lithuania GED/Equivalency Correlation Chart
The statistical analysis conducted on geographies consisting of 207,308,653 people shows a poor positive correlation between the proportion of Iroquois and percentage of population with at least ged/equivalency education in the United States with a correlation coefficient (R) of 0.105 and weighted average of 84.6%. Similarly, the statistical analysis conducted on geographies consisting of 117,724,932 people shows a slight negative correlation between the proportion of Immigrants from Lithuania and percentage of population with at least ged/equivalency education in the United States with a correlation coefficient (R) of -0.090 and weighted average of 88.6%, a difference of 4.6%.
GED/Equivalency Correlation Summary
| Measurement | Iroquois | Immigrants from Lithuania |
| Minimum | 60.8% | 82.4% |
| Maximum | 100.0% | 100.0% |
| Range | 39.2% | 17.6% |
| Mean | 84.4% | 90.9% |
| Median | 84.7% | 91.1% |
| Interquartile 25% (IQ1) | 79.6% | 89.2% |
| Interquartile 75% (IQ3) | 87.6% | 94.0% |
| Interquartile Range (IQR) | 8.0% | 4.8% |
| Standard Deviation (Sample) | 8.1% | 4.3% |
| Standard Deviation (Population) | 8.0% | 4.2% |
Similar Demographics by GED/Equivalency
Demographics Similar to Iroquois by GED/Equivalency
In terms of ged/equivalency, the demographic groups most similar to Iroquois are Immigrants from Uzbekistan (84.6%, a difference of 0.030%), Taiwanese (84.7%, a difference of 0.040%), Potawatomi (84.7%, a difference of 0.050%), American (84.7%, a difference of 0.050%), and Immigrants from Micronesia (84.7%, a difference of 0.080%).
| Demographics | Rating | Rank | GED/Equivalency |
| Peruvians | 9.2 /100 | #215 | Tragic 84.7% |
| Immigrants | Micronesia | 8.7 /100 | #216 | Tragic 84.7% |
| Nigerians | 8.6 /100 | #217 | Tragic 84.7% |
| Alaska Natives | 8.6 /100 | #218 | Tragic 84.7% |
| Potawatomi | 8.2 /100 | #219 | Tragic 84.7% |
| Americans | 8.2 /100 | #220 | Tragic 84.7% |
| Taiwanese | 8.1 /100 | #221 | Tragic 84.7% |
| Iroquois | 7.5 /100 | #222 | Tragic 84.6% |
| Immigrants | Uzbekistan | 7.1 /100 | #223 | Tragic 84.6% |
| French American Indians | 6.3 /100 | #224 | Tragic 84.6% |
| Immigrants | Thailand | 5.8 /100 | #225 | Tragic 84.5% |
| Immigrants | Zaire | 5.5 /100 | #226 | Tragic 84.5% |
| Immigrants | Costa Rica | 5.4 /100 | #227 | Tragic 84.5% |
| Immigrants | Liberia | 4.9 /100 | #228 | Tragic 84.4% |
| Immigrants | Uruguay | 4.6 /100 | #229 | Tragic 84.4% |
Demographics Similar to Immigrants from Lithuania by GED/Equivalency
In terms of ged/equivalency, the demographic groups most similar to Immigrants from Lithuania are Immigrants from Australia (88.6%, a difference of 0.030%), Russian (88.6%, a difference of 0.040%), Slovak (88.6%, a difference of 0.040%), Estonian (88.6%, a difference of 0.040%), and Immigrants from Northern Europe (88.5%, a difference of 0.040%).
| Demographics | Rating | Rank | GED/Equivalency |
| Maltese | 99.9 /100 | #20 | Exceptional 88.6% |
| Luxembourgers | 99.8 /100 | #21 | Exceptional 88.6% |
| Immigrants | Ireland | 99.8 /100 | #22 | Exceptional 88.6% |
| Russians | 99.8 /100 | #23 | Exceptional 88.6% |
| Slovaks | 99.8 /100 | #24 | Exceptional 88.6% |
| Estonians | 99.8 /100 | #25 | Exceptional 88.6% |
| Immigrants | Australia | 99.8 /100 | #26 | Exceptional 88.6% |
| Immigrants | Lithuania | 99.8 /100 | #27 | Exceptional 88.6% |
| Immigrants | Northern Europe | 99.8 /100 | #28 | Exceptional 88.5% |
| Poles | 99.8 /100 | #29 | Exceptional 88.5% |
| Turks | 99.8 /100 | #30 | Exceptional 88.5% |
| Bhutanese | 99.8 /100 | #31 | Exceptional 88.4% |
| Danes | 99.8 /100 | #32 | Exceptional 88.4% |
| Immigrants | Sweden | 99.7 /100 | #33 | Exceptional 88.4% |
| Immigrants | Japan | 99.7 /100 | #34 | Exceptional 88.4% |