Immigrants from Western Asia vs Puget Sound Salish GED/Equivalency
COMPARE
Immigrants from Western Asia
Puget Sound Salish
GED/Equivalency
GED/Equivalency Comparison
Immigrants from Western Asia
Puget Sound Salish
86.3%
GED/EQUIVALENCY
78.8/ 100
METRIC RATING
150th/ 347
METRIC RANK
85.2%
GED/EQUIVALENCY
20.8/ 100
METRIC RATING
194th/ 347
METRIC RANK
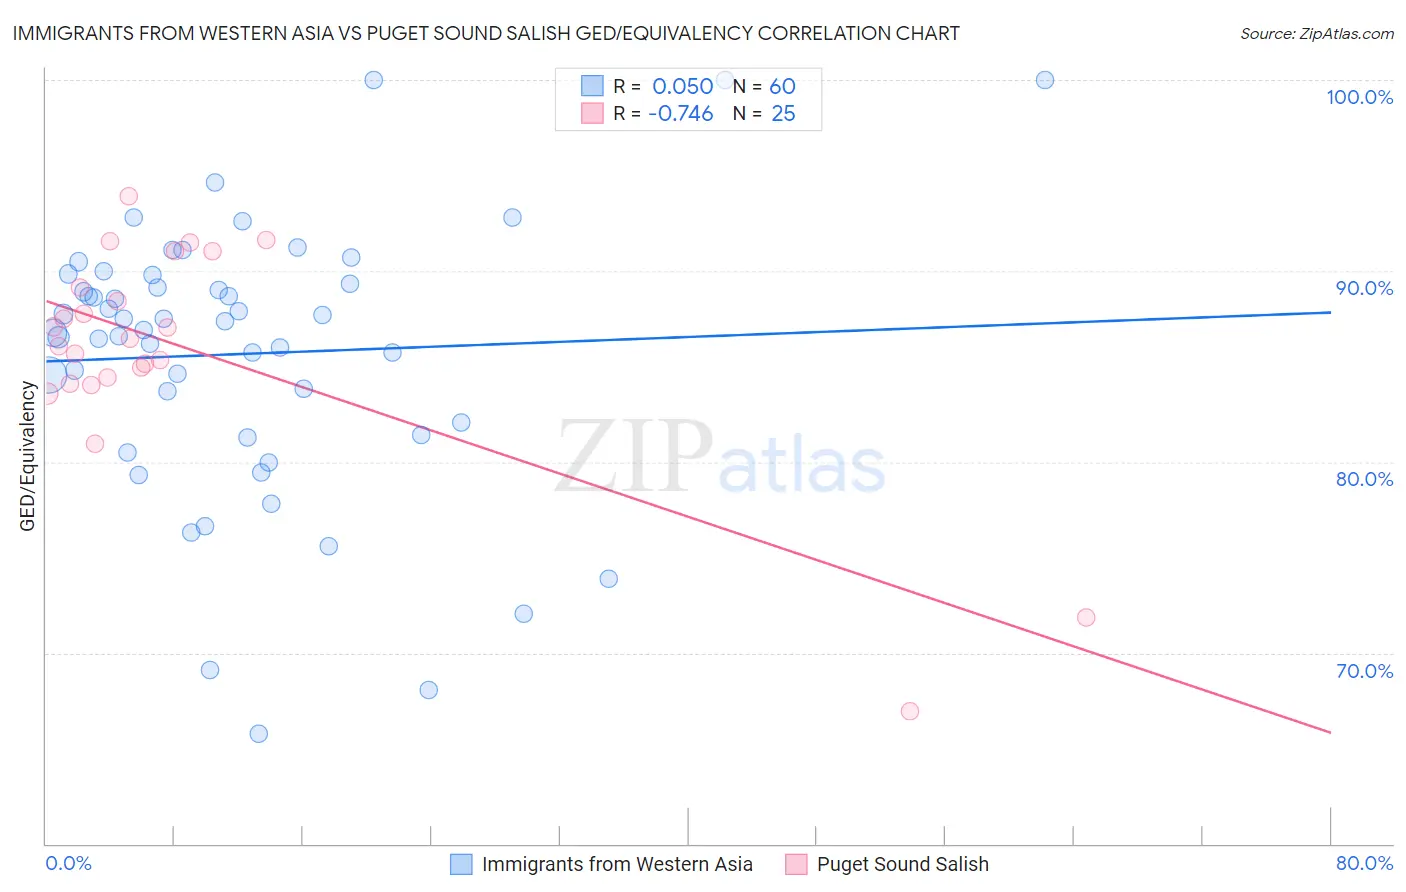
Immigrants from Western Asia vs Puget Sound Salish GED/Equivalency Correlation Chart
The statistical analysis conducted on geographies consisting of 404,408,465 people shows no correlation between the proportion of Immigrants from Western Asia and percentage of population with at least ged/equivalency education in the United States with a correlation coefficient (R) of 0.050 and weighted average of 86.3%. Similarly, the statistical analysis conducted on geographies consisting of 46,155,775 people shows a strong negative correlation between the proportion of Puget Sound Salish and percentage of population with at least ged/equivalency education in the United States with a correlation coefficient (R) of -0.746 and weighted average of 85.2%, a difference of 1.4%.
GED/Equivalency Correlation Summary
| Measurement | Immigrants from Western Asia | Puget Sound Salish |
| Minimum | 65.8% | 66.9% |
| Maximum | 100.0% | 93.9% |
| Range | 34.2% | 26.9% |
| Mean | 85.7% | 85.9% |
| Median | 87.1% | 86.5% |
| Interquartile 25% (IQ1) | 81.7% | 84.3% |
| Interquartile 75% (IQ3) | 89.6% | 90.1% |
| Interquartile Range (IQR) | 7.8% | 5.8% |
| Standard Deviation (Sample) | 7.1% | 5.9% |
| Standard Deviation (Population) | 7.1% | 5.8% |
Similar Demographics by GED/Equivalency
Demographics Similar to Immigrants from Western Asia by GED/Equivalency
In terms of ged/equivalency, the demographic groups most similar to Immigrants from Western Asia are Menominee (86.3%, a difference of 0.010%), Basque (86.4%, a difference of 0.020%), Immigrants from Northern Africa (86.3%, a difference of 0.020%), Immigrants from Poland (86.3%, a difference of 0.020%), and Immigrants from Bosnia and Herzegovina (86.3%, a difference of 0.030%).
| Demographics | Rating | Rank | GED/Equivalency |
| Immigrants | Pakistan | 82.4 /100 | #143 | Excellent 86.4% |
| Bolivians | 82.1 /100 | #144 | Excellent 86.4% |
| Pakistanis | 80.4 /100 | #145 | Excellent 86.4% |
| Basques | 79.5 /100 | #146 | Good 86.4% |
| Immigrants | Northern Africa | 79.3 /100 | #147 | Good 86.3% |
| Immigrants | Poland | 79.3 /100 | #148 | Good 86.3% |
| Menominee | 79.3 /100 | #149 | Good 86.3% |
| Immigrants | Western Asia | 78.8 /100 | #150 | Good 86.3% |
| Immigrants | Bosnia and Herzegovina | 77.9 /100 | #151 | Good 86.3% |
| Brazilians | 77.2 /100 | #152 | Good 86.3% |
| Kenyans | 76.6 /100 | #153 | Good 86.3% |
| Armenians | 76.4 /100 | #154 | Good 86.3% |
| Iraqis | 75.2 /100 | #155 | Good 86.2% |
| Immigrants | Nepal | 73.3 /100 | #156 | Good 86.2% |
| Whites/Caucasians | 72.2 /100 | #157 | Good 86.2% |
Demographics Similar to Puget Sound Salish by GED/Equivalency
In terms of ged/equivalency, the demographic groups most similar to Puget Sound Salish are Chippewa (85.2%, a difference of 0.0%), Tongan (85.2%, a difference of 0.0%), Costa Rican (85.2%, a difference of 0.010%), Delaware (85.2%, a difference of 0.040%), and South American Indian (85.2%, a difference of 0.060%).
| Demographics | Rating | Rank | GED/Equivalency |
| Immigrants | Afghanistan | 29.8 /100 | #187 | Fair 85.4% |
| Immigrants | Sierra Leone | 29.0 /100 | #188 | Fair 85.4% |
| Guamanians/Chamorros | 28.4 /100 | #189 | Fair 85.3% |
| Alaskan Athabascans | 27.5 /100 | #190 | Fair 85.3% |
| South American Indians | 22.8 /100 | #191 | Fair 85.2% |
| Immigrants | Nonimmigrants | 22.7 /100 | #192 | Fair 85.2% |
| Delaware | 22.2 /100 | #193 | Fair 85.2% |
| Puget Sound Salish | 20.8 /100 | #194 | Fair 85.2% |
| Chippewa | 20.8 /100 | #195 | Fair 85.2% |
| Tongans | 20.7 /100 | #196 | Fair 85.2% |
| Costa Ricans | 20.4 /100 | #197 | Fair 85.2% |
| Immigrants | Africa | 17.5 /100 | #198 | Poor 85.1% |
| Somalis | 16.4 /100 | #199 | Poor 85.0% |
| Uruguayans | 16.0 /100 | #200 | Poor 85.0% |
| Portuguese | 15.9 /100 | #201 | Poor 85.0% |