Immigrants from Western Asia vs Puget Sound Salish In Labor Force | Age 20-64
COMPARE
Immigrants from Western Asia
Puget Sound Salish
In Labor Force | Age 20-64
In Labor Force | Age 20-64 Comparison
Immigrants from Western Asia
Puget Sound Salish
79.2%
IN LABOR FORCE | AGE 20-64
11.0/ 100
METRIC RATING
217th/ 347
METRIC RANK
78.2%
IN LABOR FORCE | AGE 20-64
0.0/ 100
METRIC RATING
276th/ 347
METRIC RANK
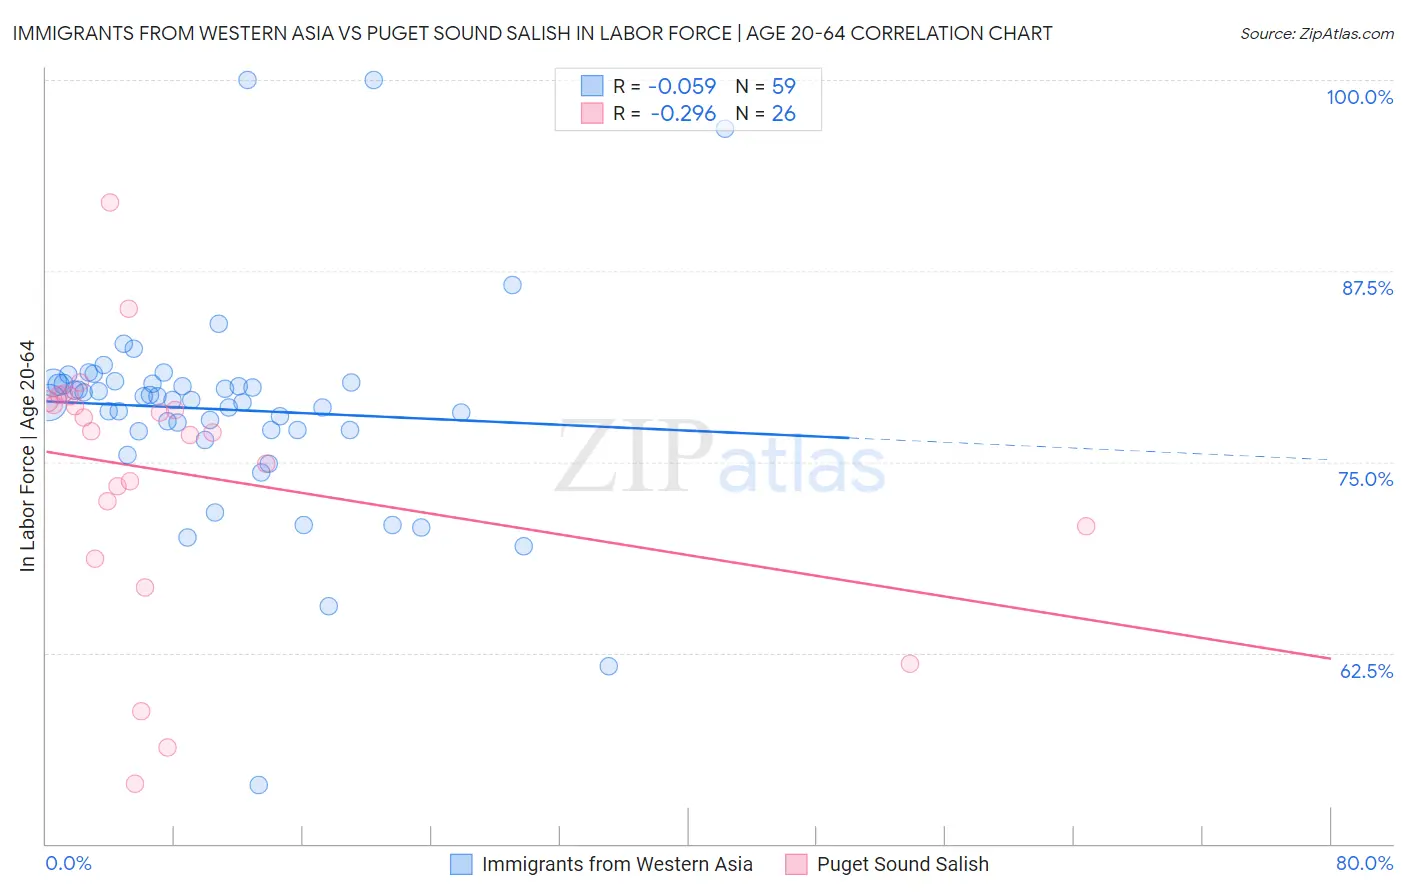
Immigrants from Western Asia vs Puget Sound Salish In Labor Force | Age 20-64 Correlation Chart
The statistical analysis conducted on geographies consisting of 404,437,919 people shows a slight negative correlation between the proportion of Immigrants from Western Asia and labor force participation rate among population between the ages 20 and 64 in the United States with a correlation coefficient (R) of -0.059 and weighted average of 79.2%. Similarly, the statistical analysis conducted on geographies consisting of 46,155,865 people shows a weak negative correlation between the proportion of Puget Sound Salish and labor force participation rate among population between the ages 20 and 64 in the United States with a correlation coefficient (R) of -0.296 and weighted average of 78.2%, a difference of 1.3%.
In Labor Force | Age 20-64 Correlation Summary
| Measurement | Immigrants from Western Asia | Puget Sound Salish |
| Minimum | 53.8% | 53.9% |
| Maximum | 100.0% | 92.0% |
| Range | 46.2% | 38.1% |
| Mean | 78.4% | 74.2% |
| Median | 79.1% | 77.0% |
| Interquartile 25% (IQ1) | 77.1% | 70.8% |
| Interquartile 75% (IQ3) | 80.2% | 79.0% |
| Interquartile Range (IQR) | 3.1% | 8.2% |
| Standard Deviation (Sample) | 7.1% | 8.7% |
| Standard Deviation (Population) | 7.1% | 8.6% |
Similar Demographics by In Labor Force | Age 20-64
Demographics Similar to Immigrants from Western Asia by In Labor Force | Age 20-64
In terms of in labor force | age 20-64, the demographic groups most similar to Immigrants from Western Asia are Arab (79.2%, a difference of 0.010%), Immigrants from Armenia (79.2%, a difference of 0.020%), Immigrants from Norway (79.2%, a difference of 0.020%), Immigrants from Portugal (79.3%, a difference of 0.030%), and Irish (79.3%, a difference of 0.040%).
| Demographics | Rating | Rank | In Labor Force | Age 20-64 |
| Haitians | 16.1 /100 | #210 | Poor 79.3% |
| Europeans | 15.3 /100 | #211 | Poor 79.3% |
| Irish | 13.2 /100 | #212 | Poor 79.3% |
| Immigrants | Portugal | 12.8 /100 | #213 | Poor 79.3% |
| Immigrants | Armenia | 12.2 /100 | #214 | Poor 79.2% |
| Immigrants | Norway | 12.0 /100 | #215 | Poor 79.2% |
| Arabs | 11.4 /100 | #216 | Poor 79.2% |
| Immigrants | Western Asia | 11.0 /100 | #217 | Poor 79.2% |
| Immigrants | England | 9.3 /100 | #218 | Tragic 79.2% |
| French Canadians | 8.4 /100 | #219 | Tragic 79.2% |
| Immigrants | Immigrants | 7.7 /100 | #220 | Tragic 79.2% |
| Hungarians | 7.2 /100 | #221 | Tragic 79.2% |
| Immigrants | Panama | 6.9 /100 | #222 | Tragic 79.1% |
| Canadians | 6.8 /100 | #223 | Tragic 79.1% |
| Immigrants | Uzbekistan | 6.8 /100 | #224 | Tragic 79.1% |
Demographics Similar to Puget Sound Salish by In Labor Force | Age 20-64
In terms of in labor force | age 20-64, the demographic groups most similar to Puget Sound Salish are Spanish (78.2%, a difference of 0.0%), Aleut (78.2%, a difference of 0.010%), Immigrants from Bahamas (78.2%, a difference of 0.010%), Mexican American Indian (78.2%, a difference of 0.020%), and French American Indian (78.2%, a difference of 0.030%).
| Demographics | Rating | Rank | In Labor Force | Age 20-64 |
| Immigrants | Barbados | 0.0 /100 | #269 | Tragic 78.3% |
| Scotch-Irish | 0.0 /100 | #270 | Tragic 78.3% |
| Immigrants | Latin America | 0.0 /100 | #271 | Tragic 78.3% |
| Marshallese | 0.0 /100 | #272 | Tragic 78.3% |
| French American Indians | 0.0 /100 | #273 | Tragic 78.2% |
| Aleuts | 0.0 /100 | #274 | Tragic 78.2% |
| Spanish | 0.0 /100 | #275 | Tragic 78.2% |
| Puget Sound Salish | 0.0 /100 | #276 | Tragic 78.2% |
| Immigrants | Bahamas | 0.0 /100 | #277 | Tragic 78.2% |
| Mexican American Indians | 0.0 /100 | #278 | Tragic 78.2% |
| Belizeans | 0.0 /100 | #279 | Tragic 78.2% |
| Immigrants | Dominica | 0.0 /100 | #280 | Tragic 78.1% |
| Guyanese | 0.0 /100 | #281 | Tragic 78.1% |
| Immigrants | St. Vincent and the Grenadines | 0.0 /100 | #282 | Tragic 78.1% |
| Immigrants | Nonimmigrants | 0.0 /100 | #283 | Tragic 78.1% |