Immigrants from Western Asia vs Immigrants from Canada GED/Equivalency
COMPARE
Immigrants from Western Asia
Immigrants from Canada
GED/Equivalency
GED/Equivalency Comparison
Immigrants from Western Asia
Immigrants from Canada
86.3%
GED/EQUIVALENCY
78.8/ 100
METRIC RATING
150th/ 347
METRIC RANK
87.9%
GED/EQUIVALENCY
99.2/ 100
METRIC RATING
64th/ 347
METRIC RANK
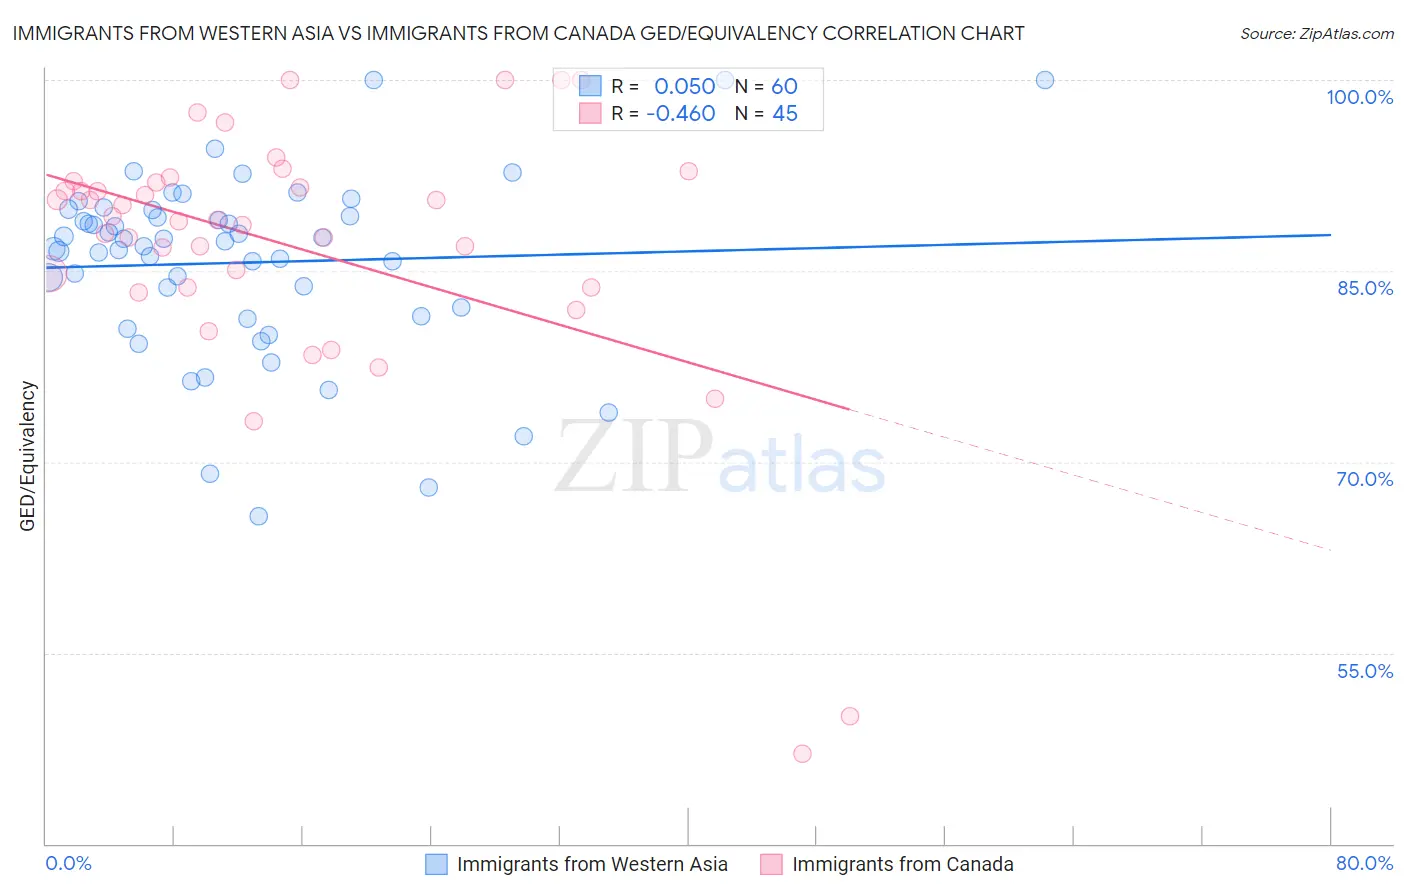
Immigrants from Western Asia vs Immigrants from Canada GED/Equivalency Correlation Chart
The statistical analysis conducted on geographies consisting of 404,408,465 people shows no correlation between the proportion of Immigrants from Western Asia and percentage of population with at least ged/equivalency education in the United States with a correlation coefficient (R) of 0.050 and weighted average of 86.3%. Similarly, the statistical analysis conducted on geographies consisting of 459,397,064 people shows a moderate negative correlation between the proportion of Immigrants from Canada and percentage of population with at least ged/equivalency education in the United States with a correlation coefficient (R) of -0.460 and weighted average of 87.9%, a difference of 1.8%.
GED/Equivalency Correlation Summary
| Measurement | Immigrants from Western Asia | Immigrants from Canada |
| Minimum | 65.8% | 47.1% |
| Maximum | 100.0% | 100.0% |
| Range | 34.2% | 52.9% |
| Mean | 85.7% | 86.9% |
| Median | 87.1% | 89.0% |
| Interquartile 25% (IQ1) | 81.7% | 83.7% |
| Interquartile 75% (IQ3) | 89.6% | 92.0% |
| Interquartile Range (IQR) | 7.8% | 8.3% |
| Standard Deviation (Sample) | 7.1% | 10.5% |
| Standard Deviation (Population) | 7.1% | 10.4% |
Similar Demographics by GED/Equivalency
Demographics Similar to Immigrants from Western Asia by GED/Equivalency
In terms of ged/equivalency, the demographic groups most similar to Immigrants from Western Asia are Menominee (86.3%, a difference of 0.010%), Basque (86.4%, a difference of 0.020%), Immigrants from Northern Africa (86.3%, a difference of 0.020%), Immigrants from Poland (86.3%, a difference of 0.020%), and Immigrants from Bosnia and Herzegovina (86.3%, a difference of 0.030%).
| Demographics | Rating | Rank | GED/Equivalency |
| Immigrants | Pakistan | 82.4 /100 | #143 | Excellent 86.4% |
| Bolivians | 82.1 /100 | #144 | Excellent 86.4% |
| Pakistanis | 80.4 /100 | #145 | Excellent 86.4% |
| Basques | 79.5 /100 | #146 | Good 86.4% |
| Immigrants | Northern Africa | 79.3 /100 | #147 | Good 86.3% |
| Immigrants | Poland | 79.3 /100 | #148 | Good 86.3% |
| Menominee | 79.3 /100 | #149 | Good 86.3% |
| Immigrants | Western Asia | 78.8 /100 | #150 | Good 86.3% |
| Immigrants | Bosnia and Herzegovina | 77.9 /100 | #151 | Good 86.3% |
| Brazilians | 77.2 /100 | #152 | Good 86.3% |
| Kenyans | 76.6 /100 | #153 | Good 86.3% |
| Armenians | 76.4 /100 | #154 | Good 86.3% |
| Iraqis | 75.2 /100 | #155 | Good 86.2% |
| Immigrants | Nepal | 73.3 /100 | #156 | Good 86.2% |
| Whites/Caucasians | 72.2 /100 | #157 | Good 86.2% |
Demographics Similar to Immigrants from Canada by GED/Equivalency
In terms of ged/equivalency, the demographic groups most similar to Immigrants from Canada are Immigrants from North America (87.8%, a difference of 0.030%), Immigrants from Bulgaria (87.8%, a difference of 0.030%), Immigrants from Turkey (87.9%, a difference of 0.040%), German (87.9%, a difference of 0.050%), and British (87.8%, a difference of 0.050%).
| Demographics | Rating | Rank | GED/Equivalency |
| Immigrants | Czechoslovakia | 99.3 /100 | #57 | Exceptional 87.9% |
| Northern Europeans | 99.3 /100 | #58 | Exceptional 87.9% |
| Serbians | 99.3 /100 | #59 | Exceptional 87.9% |
| Scandinavians | 99.3 /100 | #60 | Exceptional 87.9% |
| Europeans | 99.3 /100 | #61 | Exceptional 87.9% |
| Germans | 99.3 /100 | #62 | Exceptional 87.9% |
| Immigrants | Turkey | 99.2 /100 | #63 | Exceptional 87.9% |
| Immigrants | Canada | 99.2 /100 | #64 | Exceptional 87.9% |
| Immigrants | North America | 99.1 /100 | #65 | Exceptional 87.8% |
| Immigrants | Bulgaria | 99.1 /100 | #66 | Exceptional 87.8% |
| British | 99.1 /100 | #67 | Exceptional 87.8% |
| Immigrants | France | 99.1 /100 | #68 | Exceptional 87.8% |
| Immigrants | Saudi Arabia | 99.0 /100 | #69 | Exceptional 87.8% |
| Ukrainians | 98.8 /100 | #70 | Exceptional 87.7% |
| Austrians | 98.8 /100 | #71 | Exceptional 87.7% |