Immigrants from Western Asia vs Immigrants from Egypt GED/Equivalency

COMPARE

Immigrants from Western Asia
Race
Ancestry
AfghanAfricanAlaska NativeAlaskan AthabascanAlbanianAleutAlsatianAmericanApacheArabArapahoArgentineanArmenianAssyrian/Chaldean/SyriacAustralianAustrianBahamianBangladeshiBarbadianBasqueBelgianBelizeanBermudanBhutaneseBlackfeetBolivianBrazilianBritishBritish West IndianBulgarianBurmeseCajunCambodianCanadianCape VerdeanCarpatho RusynCelticCentral AmericanCentral American IndianCherokeeCheyenneChickasawChileanChineseChippewaChoctawColombianColvilleComancheCosta RicanCreeCreekCroatianCrowCubanCypriotCzechCzechoslovakianDanishDelawareDominicanDutchDutch West IndianEastern EuropeanEcuadorianEgyptianEnglishEstonianEthiopianEuropeanFijianFilipinoFinnishFrenchFrench American IndianFrench CanadianGermanGerman RussianGhanaianGreekGuamanian/ChamorroGuatemalanGuyaneseHaitianHmongHonduranHopiHoumaHungarianIcelanderIndian (Asian)IndonesianInupiatIranianIraqiIrishIroquoisIsraeliItalianJamaicanJapaneseJordanianKenyanKiowaKoreanLaotianLatvianLebaneseLiberianLithuanianLumbeeLuxembourgerMacedonianMalaysianMalteseMarshalleseMenomineeMexicanMexican American IndianMongolianMoroccanNative HawaiianNavajoNepaleseNew ZealanderNicaraguanNigerianNorthern EuropeanNorwegianOkinawanOsageOttawaPaiutePakistaniPalestinianPanamanianParaguayanPennsylvania GermanPeruvianPimaPolishPortuguesePotawatomiPuebloPuerto RicanPuget Sound SalishRomanianRussianSalvadoranSamoanScandinavianScotch-IrishScottishSeminoleSenegaleseSerbianShoshoneSierra LeoneanSiouxSlavicSlovakSloveneSomaliSouth AfricanSouth AmericanSouth American IndianSoviet UnionSpaniardSpanishSpanish AmericanSpanish American IndianSri LankanSubsaharan AfricanSudaneseSwedishSwissSyrianTaiwaneseThaiTlingit-HaidaTohono O'OdhamTonganTrinidadian and TobagonianTsimshianTurkishU.S. Virgin IslanderUgandanUkrainianUruguayanUteVenezuelanVietnameseWelshWest IndianYakamaYaquiYugoslavianYumanYup'ikZimbabwean
Immigration
NonimmigrantsImmigrantsAfghanistanAfricaAlbaniaArgentinaArmeniaAsiaAustraliaAustriaBahamasBangladeshBarbadosBelarusBelgiumBelizeBoliviaBosnia and HerzegovinaBrazilBulgariaBurma/MyanmarCabo VerdeCambodiaCameroonCanadaCaribbeanCentral AmericaChileChinaColombiaCongoCosta RicaCroatiaCubaCzechoslovakiaDenmarkDominicaDominican RepublicEastern AfricaEastern AsiaEastern EuropeEcuadorEl SalvadorEnglandEritreaEthiopiaEuropeFijiFranceGermanyGhanaGreeceGrenadaGuatemalaGuyanaHaitiHondurasHong KongHungaryIndiaIndonesiaIranIraqIrelandIsraelItalyJamaicaJapanJordanKazakhstanKenyaKoreaKuwaitLaosLatin AmericaLatviaLebanonLiberiaLithuaniaMalaysiaMexicoMicronesiaMiddle AfricaMoldovaMoroccoNepalNetherlandsNicaraguaNigeriaNorth AmericaNorth MacedoniaNorthern AfricaNorthern EuropeNorwayOceaniaPakistanPanamaPeruPhilippinesPolandPortugalRomaniaRussiaSaudi ArabiaScotlandSenegalSerbiaSierra LeoneSingaporeSomaliaSouth AfricaSouth AmericaSouth Central AsiaSouth Eastern AsiaSouthern EuropeSpainSri LankaSt. Vincent and the GrenadinesSudanSwedenSwitzerlandSyriaTaiwanThailandTrinidad and TobagoTurkeyUgandaUkraineUruguayUzbekistanVenezuelaVietnamWest IndiesWestern AfricaWestern AsiaWestern EuropeYemenZaireZimbabweAzores
Immigrants from Egypt
Race
Ancestry
AfghanAfricanAlaska NativeAlaskan AthabascanAlbanianAleutAlsatianAmericanApacheArabArapahoArgentineanArmenianAssyrian/Chaldean/SyriacAustralianAustrianBahamianBangladeshiBarbadianBasqueBelgianBelizeanBermudanBhutaneseBlackfeetBolivianBrazilianBritishBritish West IndianBulgarianBurmeseCajunCambodianCanadianCape VerdeanCarpatho RusynCelticCentral AmericanCentral American IndianCherokeeCheyenneChickasawChileanChineseChippewaChoctawColombianColvilleComancheCosta RicanCreeCreekCroatianCrowCubanCypriotCzechCzechoslovakianDanishDelawareDominicanDutchDutch West IndianEastern EuropeanEcuadorianEgyptianEnglishEstonianEthiopianEuropeanFijianFilipinoFinnishFrenchFrench American IndianFrench CanadianGermanGerman RussianGhanaianGreekGuamanian/ChamorroGuatemalanGuyaneseHaitianHmongHonduranHopiHoumaHungarianIcelanderIndian (Asian)IndonesianInupiatIranianIraqiIrishIroquoisIsraeliItalianJamaicanJapaneseJordanianKenyanKiowaKoreanLaotianLatvianLebaneseLiberianLithuanianLumbeeLuxembourgerMacedonianMalaysianMalteseMarshalleseMenomineeMexicanMexican American IndianMongolianMoroccanNative HawaiianNavajoNepaleseNew ZealanderNicaraguanNigerianNorthern EuropeanNorwegianOkinawanOsageOttawaPaiutePakistaniPalestinianPanamanianParaguayanPennsylvania GermanPeruvianPimaPolishPortuguesePotawatomiPuebloPuerto RicanPuget Sound SalishRomanianRussianSalvadoranSamoanScandinavianScotch-IrishScottishSeminoleSenegaleseSerbianShoshoneSierra LeoneanSiouxSlavicSlovakSloveneSomaliSouth AfricanSouth AmericanSouth American IndianSoviet UnionSpaniardSpanishSpanish AmericanSpanish American IndianSri LankanSubsaharan AfricanSudaneseSwedishSwissSyrianTaiwaneseThaiTlingit-HaidaTohono O'OdhamTonganTrinidadian and TobagonianTsimshianTurkishU.S. Virgin IslanderUgandanUkrainianUruguayanUteVenezuelanVietnameseWelshWest IndianYakamaYaquiYugoslavianYumanYup'ikZimbabwean
Immigration
NonimmigrantsImmigrantsAfghanistanAfricaAlbaniaArgentinaArmeniaAsiaAustraliaAustriaBahamasBangladeshBarbadosBelarusBelgiumBelizeBoliviaBosnia and HerzegovinaBrazilBulgariaBurma/MyanmarCabo VerdeCambodiaCameroonCanadaCaribbeanCentral AmericaChileChinaColombiaCongoCosta RicaCroatiaCubaCzechoslovakiaDenmarkDominicaDominican RepublicEastern AfricaEastern AsiaEastern EuropeEcuadorEgyptEl SalvadorEnglandEritreaEthiopiaEuropeFijiFranceGermanyGhanaGreeceGrenadaGuatemalaGuyanaHaitiHondurasHong KongHungaryIndiaIndonesiaIranIraqIrelandIsraelItalyJamaicaJapanJordanKazakhstanKenyaKoreaKuwaitLaosLatin AmericaLatviaLebanonLiberiaLithuaniaMalaysiaMexicoMicronesiaMiddle AfricaMoldovaMoroccoNepalNetherlandsNicaraguaNigeriaNorth AmericaNorth MacedoniaNorthern AfricaNorthern EuropeNorwayOceaniaPakistanPanamaPeruPhilippinesPolandPortugalRomaniaRussiaSaudi ArabiaScotlandSenegalSerbiaSierra LeoneSingaporeSomaliaSouth AfricaSouth AmericaSouth Central AsiaSouth Eastern AsiaSouthern EuropeSpainSri LankaSt. Vincent and the GrenadinesSudanSwedenSwitzerlandSyriaTaiwanThailandTrinidad and TobagoTurkeyUgandaUkraineUruguayUzbekistanVenezuelaVietnamWest IndiesWestern AfricaWestern EuropeYemenZaireZimbabweAzores
GED/Equivalency
Income
Poverty
Unemployment
Labor Participation
Family Structure
Vehicle Availability
Education Level
Disability

GED/Equivalency Comparison

Immigrants from Western Asia

Immigrants from Egypt

Good
Exceptional
86.3%
GED/EQUIVALENCY
78.8/ 100
METRIC RATING
150th/ 347
METRIC RANK
86.7%
GED/EQUIVALENCY
90.4/ 100
METRIC RATING
124th/ 347
METRIC RANK

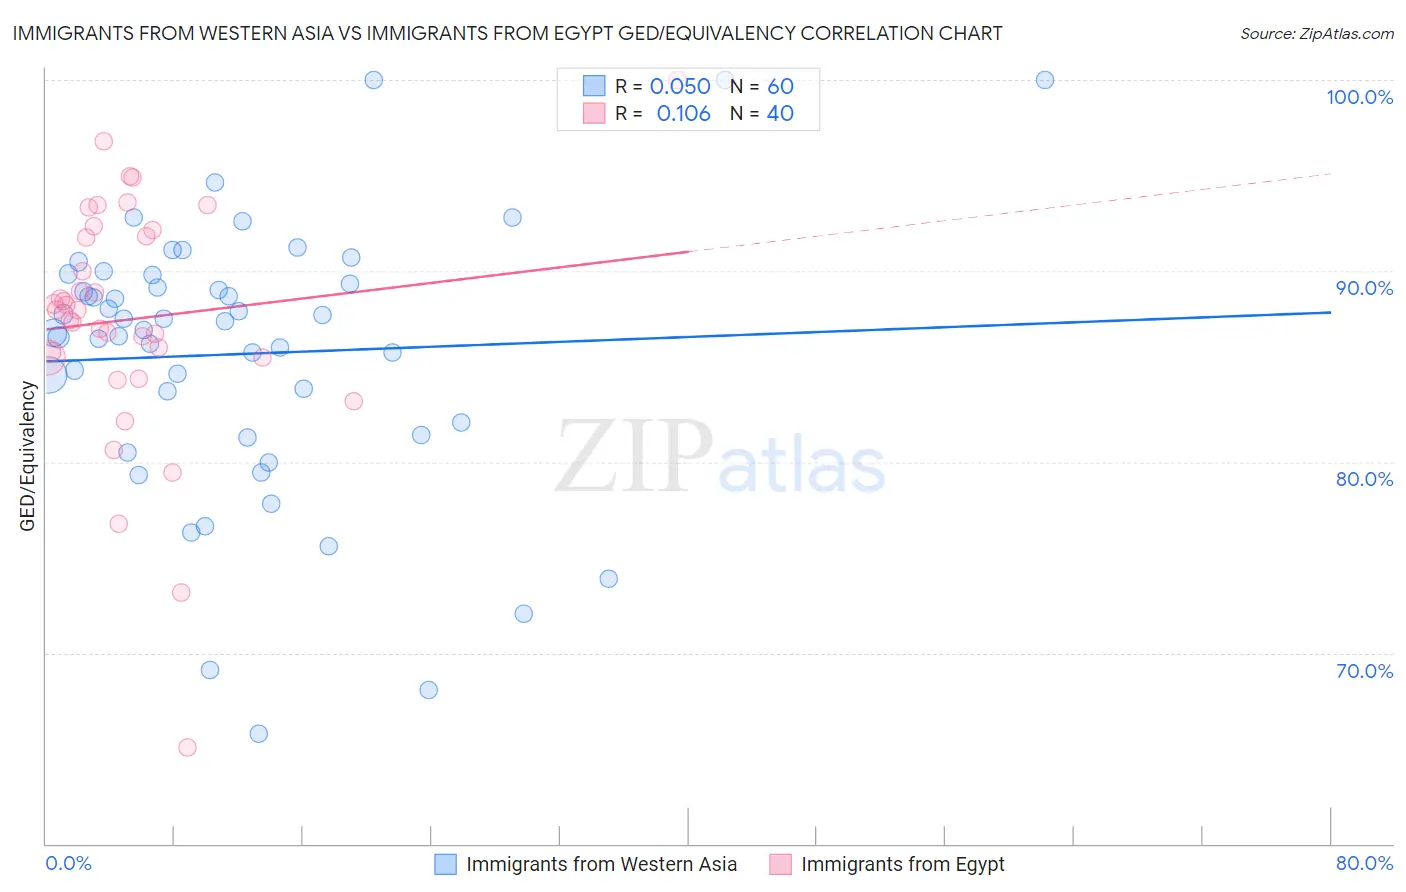
Immigrants from Western Asia vs Immigrants from Egypt GED/Equivalency Correlation Chart

The statistical analysis conducted on geographies consisting of 404,408,465 people shows no correlation between the proportion of Immigrants from Western Asia and percentage of population with at least ged/equivalency education in the United States with a correlation coefficient (R) of 0.050 and weighted average of 86.3%. Similarly, the statistical analysis conducted on geographies consisting of 245,485,633 people shows a poor positive correlation between the proportion of Immigrants from Egypt and percentage of population with at least ged/equivalency education in the United States with a correlation coefficient (R) of 0.106 and weighted average of 86.7%, a difference of 0.47%.
Immigrants from Western Asia vs Immigrants from Egypt GED/Equivalency

GED/Equivalency Correlation Summary

MeasurementImmigrants from Western AsiaImmigrants from Egypt
Minimum65.8%65.1%
Maximum100.0%100.0%
Range34.2%34.9%
Mean85.7%87.5%
Median87.1%88.0%
Interquartile 25% (IQ1)81.7%85.5%
Interquartile 75% (IQ3)89.6%92.0%
Interquartile Range (IQR)7.8%6.5%
Standard Deviation (Sample)7.1%6.4%
Standard Deviation (Population)7.1%6.3%

Similar Demographics by GED/Equivalency

Demographics Similar to Immigrants from Western Asia by GED/Equivalency

In terms of ged/equivalency, the demographic groups most similar to Immigrants from Western Asia are Menominee (86.3%, a difference of 0.010%), Basque (86.4%, a difference of 0.020%), Immigrants from Northern Africa (86.3%, a difference of 0.020%), Immigrants from Poland (86.3%, a difference of 0.020%), and Immigrants from Bosnia and Herzegovina (86.3%, a difference of 0.030%).
DemographicsRating | RankGED/Equivalency
Immigrants | Pakistan
82.4
/100
|
#143
Excellent
86.4%
Bolivians
82.1
/100
|
#144
Excellent
86.4%
Pakistanis
80.4
/100
|
#145
Excellent
86.4%
Basques
79.5
/100
|
#146
Good
86.4%
Immigrants | Northern Africa
79.3
/100
|
#147
Good
86.3%
Immigrants | Poland
79.3
/100
|
#148
Good
86.3%
Menominee
79.3
/100
|
#149
Good
86.3%
Immigrants | Western Asia
78.8
/100
|
#150
Good
86.3%
Immigrants | Bosnia and Herzegovina
77.9
/100
|
#151
Good
86.3%
Brazilians
77.2
/100
|
#152
Good
86.3%
Kenyans
76.6
/100
|
#153
Good
86.3%
Armenians
76.4
/100
|
#154
Good
86.3%
Iraqis
75.2
/100
|
#155
Good
86.2%
Immigrants | Nepal
73.3
/100
|
#156
Good
86.2%
Whites/Caucasians
72.2
/100
|
#157
Good
86.2%

Demographics Similar to Immigrants from Egypt by GED/Equivalency

In terms of ged/equivalency, the demographic groups most similar to Immigrants from Egypt are Celtic (86.7%, a difference of 0.0%), Immigrants from Italy (86.7%, a difference of 0.010%), Asian (86.7%, a difference of 0.010%), Immigrants from Lebanon (86.8%, a difference of 0.030%), and Immigrants from Jordan (86.8%, a difference of 0.030%).
DemographicsRating | RankGED/Equivalency
Immigrants | Hong Kong
93.8
/100
|
#117
Exceptional
86.9%
French Canadians
93.2
/100
|
#118
Exceptional
86.9%
Immigrants | China
93.2
/100
|
#119
Exceptional
86.9%
Scotch-Irish
91.6
/100
|
#120
Exceptional
86.8%
Immigrants | Lebanon
90.9
/100
|
#121
Exceptional
86.8%
Immigrants | Jordan
90.8
/100
|
#122
Exceptional
86.8%
Immigrants | Italy
90.5
/100
|
#123
Exceptional
86.7%
Immigrants | Egypt
90.4
/100
|
#124
Exceptional
86.7%
Celtics
90.4
/100
|
#125
Exceptional
86.7%
Asians
90.3
/100
|
#126
Exceptional
86.7%
Argentineans
89.7
/100
|
#127
Excellent
86.7%
Yugoslavians
89.5
/100
|
#128
Excellent
86.7%
Immigrants | Ukraine
88.9
/100
|
#129
Excellent
86.7%
Immigrants | Germany
88.8
/100
|
#130
Excellent
86.7%
Immigrants | Spain
88.5
/100
|
#131
Excellent
86.7%