Immigrants from Western Asia vs Filipino GED/Equivalency
COMPARE
Immigrants from Western Asia
Filipino
GED/Equivalency
GED/Equivalency Comparison
Immigrants from Western Asia
Filipinos
86.3%
GED/EQUIVALENCY
78.8/ 100
METRIC RATING
150th/ 347
METRIC RANK
89.5%
GED/EQUIVALENCY
100.0/ 100
METRIC RATING
2nd/ 347
METRIC RANK
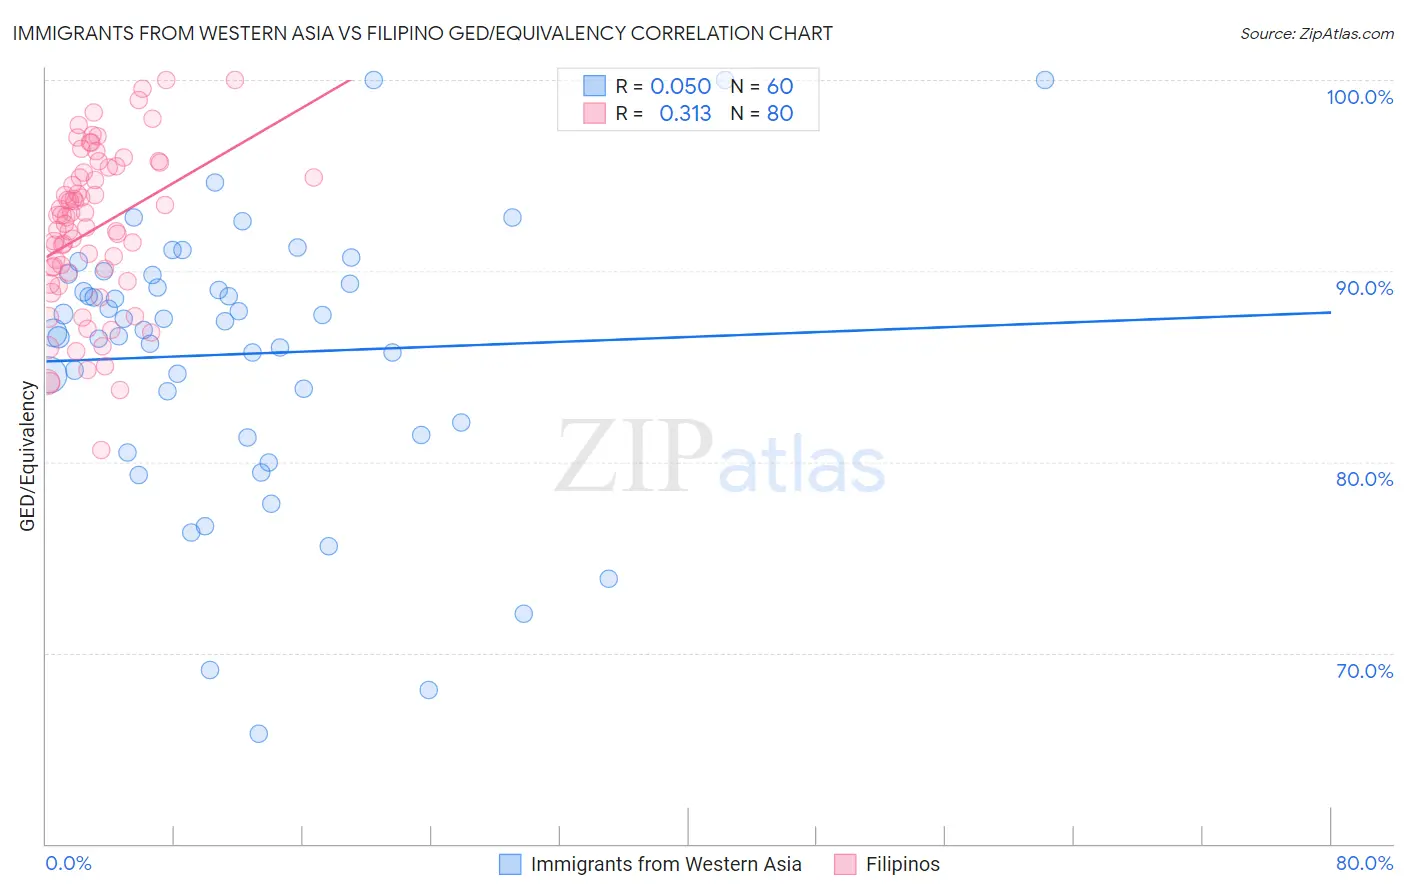
Immigrants from Western Asia vs Filipino GED/Equivalency Correlation Chart
The statistical analysis conducted on geographies consisting of 404,408,465 people shows no correlation between the proportion of Immigrants from Western Asia and percentage of population with at least ged/equivalency education in the United States with a correlation coefficient (R) of 0.050 and weighted average of 86.3%. Similarly, the statistical analysis conducted on geographies consisting of 254,349,672 people shows a mild positive correlation between the proportion of Filipinos and percentage of population with at least ged/equivalency education in the United States with a correlation coefficient (R) of 0.313 and weighted average of 89.5%, a difference of 3.7%.
GED/Equivalency Correlation Summary
| Measurement | Immigrants from Western Asia | Filipino |
| Minimum | 65.8% | 80.6% |
| Maximum | 100.0% | 100.0% |
| Range | 34.2% | 19.4% |
| Mean | 85.7% | 92.2% |
| Median | 87.1% | 92.7% |
| Interquartile 25% (IQ1) | 81.7% | 89.7% |
| Interquartile 75% (IQ3) | 89.6% | 95.3% |
| Interquartile Range (IQR) | 7.8% | 5.6% |
| Standard Deviation (Sample) | 7.1% | 4.2% |
| Standard Deviation (Population) | 7.1% | 4.2% |
Similar Demographics by GED/Equivalency
Demographics Similar to Immigrants from Western Asia by GED/Equivalency
In terms of ged/equivalency, the demographic groups most similar to Immigrants from Western Asia are Menominee (86.3%, a difference of 0.010%), Basque (86.4%, a difference of 0.020%), Immigrants from Northern Africa (86.3%, a difference of 0.020%), Immigrants from Poland (86.3%, a difference of 0.020%), and Immigrants from Bosnia and Herzegovina (86.3%, a difference of 0.030%).
| Demographics | Rating | Rank | GED/Equivalency |
| Immigrants | Pakistan | 82.4 /100 | #143 | Excellent 86.4% |
| Bolivians | 82.1 /100 | #144 | Excellent 86.4% |
| Pakistanis | 80.4 /100 | #145 | Excellent 86.4% |
| Basques | 79.5 /100 | #146 | Good 86.4% |
| Immigrants | Northern Africa | 79.3 /100 | #147 | Good 86.3% |
| Immigrants | Poland | 79.3 /100 | #148 | Good 86.3% |
| Menominee | 79.3 /100 | #149 | Good 86.3% |
| Immigrants | Western Asia | 78.8 /100 | #150 | Good 86.3% |
| Immigrants | Bosnia and Herzegovina | 77.9 /100 | #151 | Good 86.3% |
| Brazilians | 77.2 /100 | #152 | Good 86.3% |
| Kenyans | 76.6 /100 | #153 | Good 86.3% |
| Armenians | 76.4 /100 | #154 | Good 86.3% |
| Iraqis | 75.2 /100 | #155 | Good 86.2% |
| Immigrants | Nepal | 73.3 /100 | #156 | Good 86.2% |
| Whites/Caucasians | 72.2 /100 | #157 | Good 86.2% |
Demographics Similar to Filipinos by GED/Equivalency
In terms of ged/equivalency, the demographic groups most similar to Filipinos are Immigrants from Singapore (89.3%, a difference of 0.21%), Immigrants from India (89.7%, a difference of 0.26%), Iranian (89.2%, a difference of 0.30%), Latvian (89.2%, a difference of 0.40%), and Thai (89.1%, a difference of 0.42%).
| Demographics | Rating | Rank | GED/Equivalency |
| Immigrants | India | 100.0 /100 | #1 | Exceptional 89.7% |
| Filipinos | 100.0 /100 | #2 | Exceptional 89.5% |
| Immigrants | Singapore | 100.0 /100 | #3 | Exceptional 89.3% |
| Iranians | 100.0 /100 | #4 | Exceptional 89.2% |
| Latvians | 100.0 /100 | #5 | Exceptional 89.2% |
| Thais | 100.0 /100 | #6 | Exceptional 89.1% |
| Eastern Europeans | 99.9 /100 | #7 | Exceptional 89.1% |
| Carpatho Rusyns | 99.9 /100 | #8 | Exceptional 89.1% |
| Chinese | 99.9 /100 | #9 | Exceptional 89.0% |
| Norwegians | 99.9 /100 | #10 | Exceptional 89.0% |
| Bulgarians | 99.9 /100 | #11 | Exceptional 89.0% |
| Lithuanians | 99.9 /100 | #12 | Exceptional 88.9% |
| Immigrants | Iran | 99.9 /100 | #13 | Exceptional 88.9% |
| Cypriots | 99.9 /100 | #14 | Exceptional 88.9% |
| Okinawans | 99.9 /100 | #15 | Exceptional 88.9% |