Immigrants from Western Asia vs Immigrants from Latin America GED/Equivalency
COMPARE
Immigrants from Western Asia
Immigrants from Latin America
GED/Equivalency
GED/Equivalency Comparison
Immigrants from Western Asia
Immigrants from Latin America
86.3%
GED/EQUIVALENCY
78.8/ 100
METRIC RATING
150th/ 347
METRIC RANK
78.5%
GED/EQUIVALENCY
0.0/ 100
METRIC RATING
335th/ 347
METRIC RANK
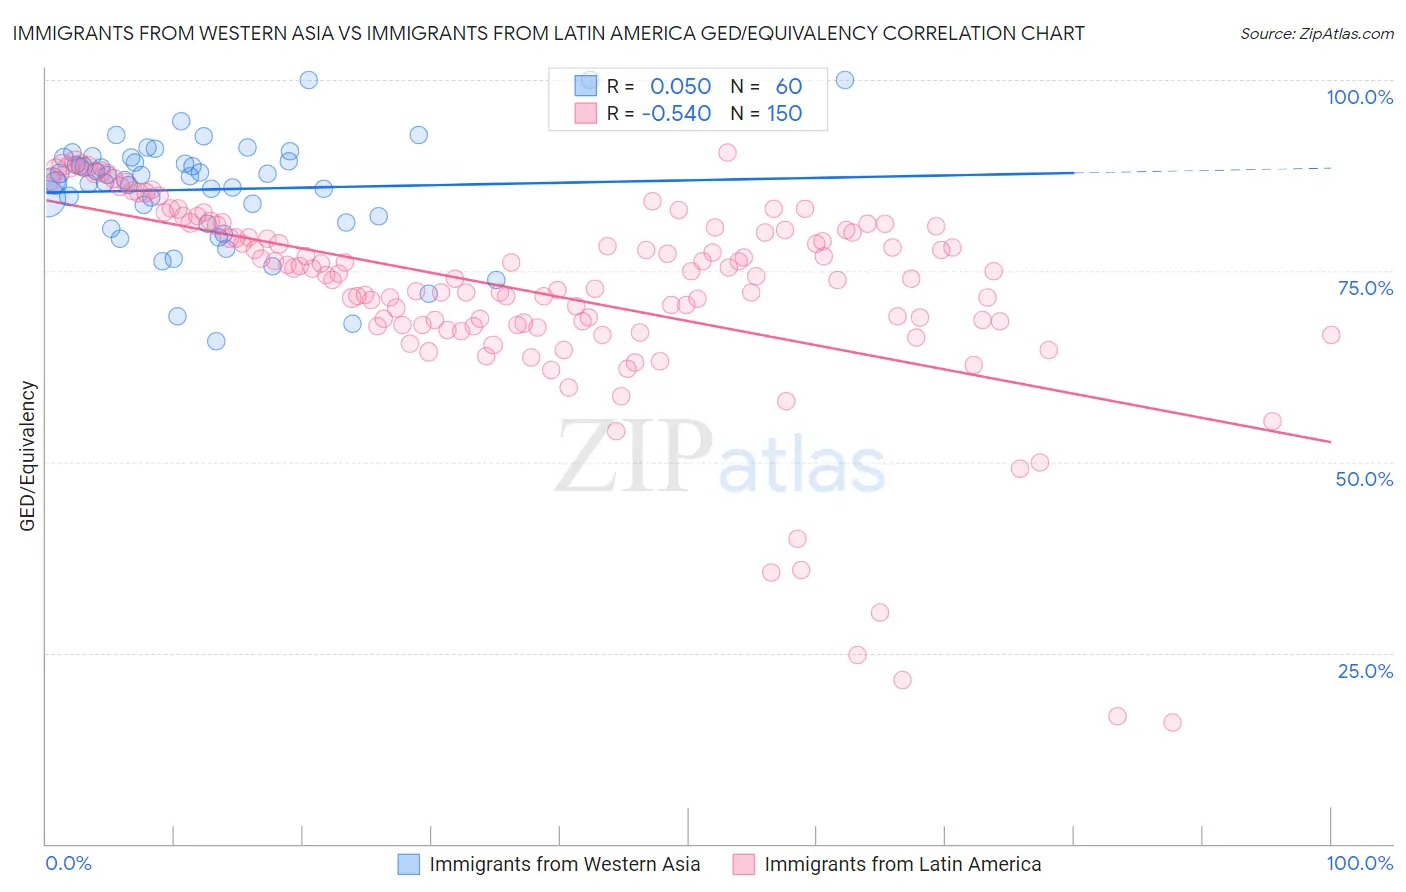
Immigrants from Western Asia vs Immigrants from Latin America GED/Equivalency Correlation Chart
The statistical analysis conducted on geographies consisting of 404,408,465 people shows no correlation between the proportion of Immigrants from Western Asia and percentage of population with at least ged/equivalency education in the United States with a correlation coefficient (R) of 0.050 and weighted average of 86.3%. Similarly, the statistical analysis conducted on geographies consisting of 558,649,843 people shows a substantial negative correlation between the proportion of Immigrants from Latin America and percentage of population with at least ged/equivalency education in the United States with a correlation coefficient (R) of -0.540 and weighted average of 78.5%, a difference of 10.0%.
GED/Equivalency Correlation Summary
| Measurement | Immigrants from Western Asia | Immigrants from Latin America |
| Minimum | 65.8% | 16.0% |
| Maximum | 100.0% | 90.5% |
| Range | 34.2% | 74.6% |
| Mean | 85.7% | 72.1% |
| Median | 87.1% | 74.6% |
| Interquartile 25% (IQ1) | 81.7% | 68.0% |
| Interquartile 75% (IQ3) | 89.6% | 80.4% |
| Interquartile Range (IQR) | 7.8% | 12.4% |
| Standard Deviation (Sample) | 7.1% | 13.6% |
| Standard Deviation (Population) | 7.1% | 13.5% |
Similar Demographics by GED/Equivalency
Demographics Similar to Immigrants from Western Asia by GED/Equivalency
In terms of ged/equivalency, the demographic groups most similar to Immigrants from Western Asia are Menominee (86.3%, a difference of 0.010%), Basque (86.4%, a difference of 0.020%), Immigrants from Northern Africa (86.3%, a difference of 0.020%), Immigrants from Poland (86.3%, a difference of 0.020%), and Immigrants from Bosnia and Herzegovina (86.3%, a difference of 0.030%).
| Demographics | Rating | Rank | GED/Equivalency |
| Immigrants | Pakistan | 82.4 /100 | #143 | Excellent 86.4% |
| Bolivians | 82.1 /100 | #144 | Excellent 86.4% |
| Pakistanis | 80.4 /100 | #145 | Excellent 86.4% |
| Basques | 79.5 /100 | #146 | Good 86.4% |
| Immigrants | Northern Africa | 79.3 /100 | #147 | Good 86.3% |
| Immigrants | Poland | 79.3 /100 | #148 | Good 86.3% |
| Menominee | 79.3 /100 | #149 | Good 86.3% |
| Immigrants | Western Asia | 78.8 /100 | #150 | Good 86.3% |
| Immigrants | Bosnia and Herzegovina | 77.9 /100 | #151 | Good 86.3% |
| Brazilians | 77.2 /100 | #152 | Good 86.3% |
| Kenyans | 76.6 /100 | #153 | Good 86.3% |
| Armenians | 76.4 /100 | #154 | Good 86.3% |
| Iraqis | 75.2 /100 | #155 | Good 86.2% |
| Immigrants | Nepal | 73.3 /100 | #156 | Good 86.2% |
| Whites/Caucasians | 72.2 /100 | #157 | Good 86.2% |
Demographics Similar to Immigrants from Latin America by GED/Equivalency
In terms of ged/equivalency, the demographic groups most similar to Immigrants from Latin America are Guatemalan (78.5%, a difference of 0.020%), Salvadoran (78.6%, a difference of 0.11%), Immigrants from the Azores (78.7%, a difference of 0.22%), Immigrants from Honduras (78.7%, a difference of 0.33%), and Immigrants from Cabo Verde (78.9%, a difference of 0.58%).
| Demographics | Rating | Rank | GED/Equivalency |
| Hispanics or Latinos | 0.0 /100 | #328 | Tragic 79.1% |
| Dominicans | 0.0 /100 | #329 | Tragic 79.1% |
| Immigrants | Cabo Verde | 0.0 /100 | #330 | Tragic 78.9% |
| Immigrants | Honduras | 0.0 /100 | #331 | Tragic 78.7% |
| Immigrants | Azores | 0.0 /100 | #332 | Tragic 78.7% |
| Salvadorans | 0.0 /100 | #333 | Tragic 78.6% |
| Guatemalans | 0.0 /100 | #334 | Tragic 78.5% |
| Immigrants | Latin America | 0.0 /100 | #335 | Tragic 78.5% |
| Immigrants | Dominican Republic | 0.0 /100 | #336 | Tragic 78.0% |
| Immigrants | Yemen | 0.0 /100 | #337 | Tragic 77.9% |
| Immigrants | Guatemala | 0.0 /100 | #338 | Tragic 77.9% |
| Immigrants | El Salvador | 0.0 /100 | #339 | Tragic 77.6% |
| Tohono O'odham | 0.0 /100 | #340 | Tragic 77.5% |
| Mexicans | 0.0 /100 | #341 | Tragic 77.4% |
| Pima | 0.0 /100 | #342 | Tragic 76.4% |