Immigrants from Czechoslovakia vs Norwegian GED/Equivalency
COMPARE
Immigrants from Czechoslovakia
Norwegian
GED/Equivalency
GED/Equivalency Comparison
Immigrants from Czechoslovakia
Norwegians
87.9%
GED/EQUIVALENCY
99.3/ 100
METRIC RATING
57th/ 347
METRIC RANK
89.0%
GED/EQUIVALENCY
99.9/ 100
METRIC RATING
10th/ 347
METRIC RANK
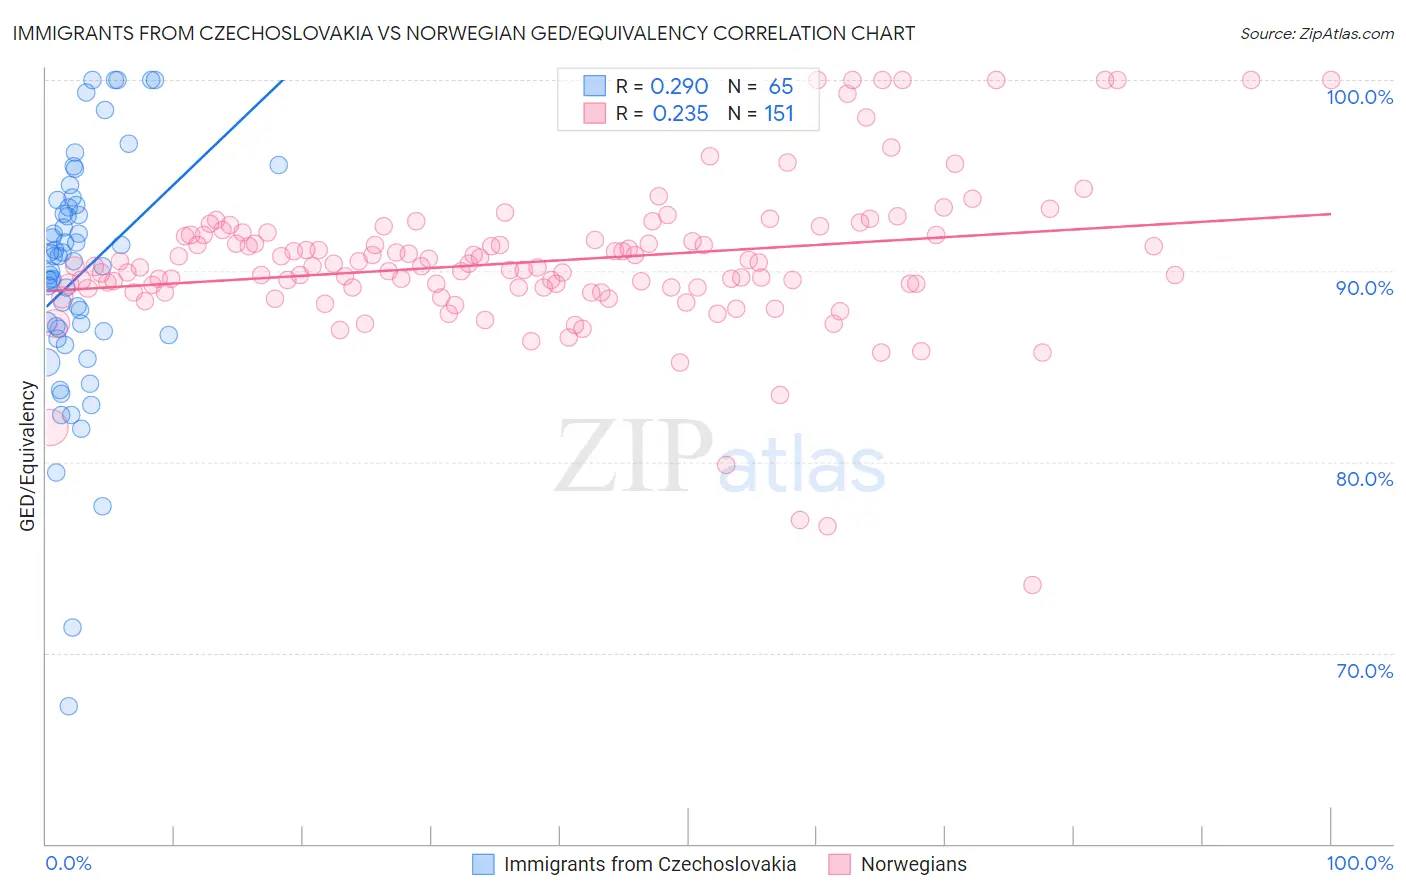
Immigrants from Czechoslovakia vs Norwegian GED/Equivalency Correlation Chart
The statistical analysis conducted on geographies consisting of 195,448,106 people shows a weak positive correlation between the proportion of Immigrants from Czechoslovakia and percentage of population with at least ged/equivalency education in the United States with a correlation coefficient (R) of 0.290 and weighted average of 87.9%. Similarly, the statistical analysis conducted on geographies consisting of 533,395,248 people shows a weak positive correlation between the proportion of Norwegians and percentage of population with at least ged/equivalency education in the United States with a correlation coefficient (R) of 0.235 and weighted average of 89.0%, a difference of 1.2%.
GED/Equivalency Correlation Summary
| Measurement | Immigrants from Czechoslovakia | Norwegian |
| Minimum | 67.2% | 73.5% |
| Maximum | 100.0% | 100.0% |
| Range | 32.8% | 26.5% |
| Mean | 89.8% | 90.5% |
| Median | 90.5% | 90.2% |
| Interquartile 25% (IQ1) | 86.7% | 89.1% |
| Interquartile 75% (IQ3) | 93.4% | 91.9% |
| Interquartile Range (IQR) | 6.6% | 2.8% |
| Standard Deviation (Sample) | 6.3% | 4.0% |
| Standard Deviation (Population) | 6.3% | 4.0% |
Similar Demographics by GED/Equivalency
Demographics Similar to Immigrants from Czechoslovakia by GED/Equivalency
In terms of ged/equivalency, the demographic groups most similar to Immigrants from Czechoslovakia are Northern European (87.9%, a difference of 0.0%), Serbian (87.9%, a difference of 0.010%), Scandinavian (87.9%, a difference of 0.020%), European (87.9%, a difference of 0.020%), and German (87.9%, a difference of 0.040%).
| Demographics | Rating | Rank | GED/Equivalency |
| Immigrants | Korea | 99.5 /100 | #50 | Exceptional 88.1% |
| Immigrants | Netherlands | 99.4 /100 | #51 | Exceptional 88.0% |
| Zimbabweans | 99.4 /100 | #52 | Exceptional 88.0% |
| Immigrants | South Africa | 99.4 /100 | #53 | Exceptional 88.0% |
| Soviet Union | 99.4 /100 | #54 | Exceptional 88.0% |
| New Zealanders | 99.4 /100 | #55 | Exceptional 88.0% |
| Immigrants | Denmark | 99.4 /100 | #56 | Exceptional 88.0% |
| Immigrants | Czechoslovakia | 99.3 /100 | #57 | Exceptional 87.9% |
| Northern Europeans | 99.3 /100 | #58 | Exceptional 87.9% |
| Serbians | 99.3 /100 | #59 | Exceptional 87.9% |
| Scandinavians | 99.3 /100 | #60 | Exceptional 87.9% |
| Europeans | 99.3 /100 | #61 | Exceptional 87.9% |
| Germans | 99.3 /100 | #62 | Exceptional 87.9% |
| Immigrants | Turkey | 99.2 /100 | #63 | Exceptional 87.9% |
| Immigrants | Canada | 99.2 /100 | #64 | Exceptional 87.9% |
Demographics Similar to Norwegians by GED/Equivalency
In terms of ged/equivalency, the demographic groups most similar to Norwegians are Chinese (89.0%, a difference of 0.040%), Bulgarian (89.0%, a difference of 0.040%), Carpatho Rusyn (89.1%, a difference of 0.070%), Lithuanian (88.9%, a difference of 0.080%), and Immigrants from Iran (88.9%, a difference of 0.080%).
| Demographics | Rating | Rank | GED/Equivalency |
| Immigrants | Singapore | 100.0 /100 | #3 | Exceptional 89.3% |
| Iranians | 100.0 /100 | #4 | Exceptional 89.2% |
| Latvians | 100.0 /100 | #5 | Exceptional 89.2% |
| Thais | 100.0 /100 | #6 | Exceptional 89.1% |
| Eastern Europeans | 99.9 /100 | #7 | Exceptional 89.1% |
| Carpatho Rusyns | 99.9 /100 | #8 | Exceptional 89.1% |
| Chinese | 99.9 /100 | #9 | Exceptional 89.0% |
| Norwegians | 99.9 /100 | #10 | Exceptional 89.0% |
| Bulgarians | 99.9 /100 | #11 | Exceptional 89.0% |
| Lithuanians | 99.9 /100 | #12 | Exceptional 88.9% |
| Immigrants | Iran | 99.9 /100 | #13 | Exceptional 88.9% |
| Cypriots | 99.9 /100 | #14 | Exceptional 88.9% |
| Okinawans | 99.9 /100 | #15 | Exceptional 88.9% |
| Immigrants | Taiwan | 99.9 /100 | #16 | Exceptional 88.8% |
| Croatians | 99.9 /100 | #17 | Exceptional 88.8% |