Immigrants from Sudan vs Norwegian GED/Equivalency
COMPARE
Immigrants from Sudan
Norwegian
GED/Equivalency
GED/Equivalency Comparison
Immigrants from Sudan
Norwegians
85.5%
GED/EQUIVALENCY
34.2/ 100
METRIC RATING
183rd/ 347
METRIC RANK
89.0%
GED/EQUIVALENCY
99.9/ 100
METRIC RATING
10th/ 347
METRIC RANK
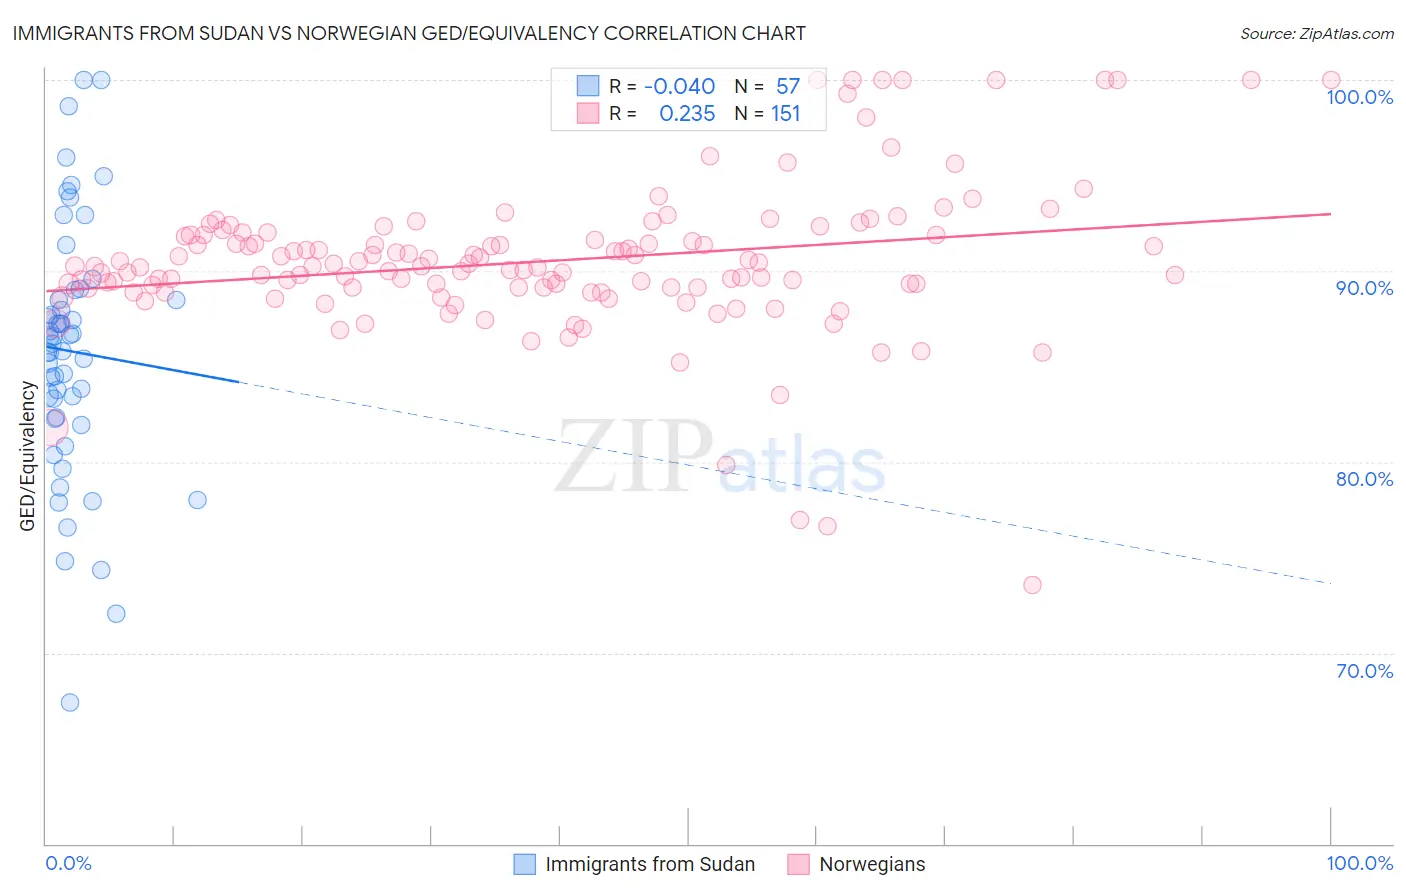
Immigrants from Sudan vs Norwegian GED/Equivalency Correlation Chart
The statistical analysis conducted on geographies consisting of 118,959,807 people shows no correlation between the proportion of Immigrants from Sudan and percentage of population with at least ged/equivalency education in the United States with a correlation coefficient (R) of -0.040 and weighted average of 85.5%. Similarly, the statistical analysis conducted on geographies consisting of 533,395,248 people shows a weak positive correlation between the proportion of Norwegians and percentage of population with at least ged/equivalency education in the United States with a correlation coefficient (R) of 0.235 and weighted average of 89.0%, a difference of 4.1%.
GED/Equivalency Correlation Summary
| Measurement | Immigrants from Sudan | Norwegian |
| Minimum | 67.4% | 73.5% |
| Maximum | 100.0% | 100.0% |
| Range | 32.6% | 26.5% |
| Mean | 85.8% | 90.5% |
| Median | 86.2% | 90.2% |
| Interquartile 25% (IQ1) | 82.3% | 89.1% |
| Interquartile 75% (IQ3) | 88.7% | 91.9% |
| Interquartile Range (IQR) | 6.4% | 2.8% |
| Standard Deviation (Sample) | 6.6% | 4.0% |
| Standard Deviation (Population) | 6.5% | 4.0% |
Similar Demographics by GED/Equivalency
Demographics Similar to Immigrants from Sudan by GED/Equivalency
In terms of ged/equivalency, the demographic groups most similar to Immigrants from Sudan are Immigrants from Oceania (85.5%, a difference of 0.010%), Sudanese (85.5%, a difference of 0.020%), Spanish (85.4%, a difference of 0.030%), Spaniard (85.4%, a difference of 0.050%), and Moroccan (85.5%, a difference of 0.080%).
| Demographics | Rating | Rank | GED/Equivalency |
| Immigrants | Eastern Africa | 47.7 /100 | #176 | Average 85.7% |
| Immigrants | Uganda | 45.2 /100 | #177 | Average 85.7% |
| Koreans | 41.2 /100 | #178 | Average 85.6% |
| Aleuts | 40.5 /100 | #179 | Average 85.6% |
| Immigrants | Southern Europe | 38.4 /100 | #180 | Fair 85.5% |
| Moroccans | 37.7 /100 | #181 | Fair 85.5% |
| Sudanese | 35.2 /100 | #182 | Fair 85.5% |
| Immigrants | Sudan | 34.2 /100 | #183 | Fair 85.5% |
| Immigrants | Oceania | 33.6 /100 | #184 | Fair 85.5% |
| Spanish | 32.8 /100 | #185 | Fair 85.4% |
| Spaniards | 31.9 /100 | #186 | Fair 85.4% |
| Immigrants | Afghanistan | 29.8 /100 | #187 | Fair 85.4% |
| Immigrants | Sierra Leone | 29.0 /100 | #188 | Fair 85.4% |
| Guamanians/Chamorros | 28.4 /100 | #189 | Fair 85.3% |
| Alaskan Athabascans | 27.5 /100 | #190 | Fair 85.3% |
Demographics Similar to Norwegians by GED/Equivalency
In terms of ged/equivalency, the demographic groups most similar to Norwegians are Chinese (89.0%, a difference of 0.040%), Bulgarian (89.0%, a difference of 0.040%), Carpatho Rusyn (89.1%, a difference of 0.070%), Lithuanian (88.9%, a difference of 0.080%), and Immigrants from Iran (88.9%, a difference of 0.080%).
| Demographics | Rating | Rank | GED/Equivalency |
| Immigrants | Singapore | 100.0 /100 | #3 | Exceptional 89.3% |
| Iranians | 100.0 /100 | #4 | Exceptional 89.2% |
| Latvians | 100.0 /100 | #5 | Exceptional 89.2% |
| Thais | 100.0 /100 | #6 | Exceptional 89.1% |
| Eastern Europeans | 99.9 /100 | #7 | Exceptional 89.1% |
| Carpatho Rusyns | 99.9 /100 | #8 | Exceptional 89.1% |
| Chinese | 99.9 /100 | #9 | Exceptional 89.0% |
| Norwegians | 99.9 /100 | #10 | Exceptional 89.0% |
| Bulgarians | 99.9 /100 | #11 | Exceptional 89.0% |
| Lithuanians | 99.9 /100 | #12 | Exceptional 88.9% |
| Immigrants | Iran | 99.9 /100 | #13 | Exceptional 88.9% |
| Cypriots | 99.9 /100 | #14 | Exceptional 88.9% |
| Okinawans | 99.9 /100 | #15 | Exceptional 88.9% |
| Immigrants | Taiwan | 99.9 /100 | #16 | Exceptional 88.8% |
| Croatians | 99.9 /100 | #17 | Exceptional 88.8% |