Immigrants from Sudan vs Norwegian Single Male Poverty
COMPARE
Immigrants from Sudan
Norwegian
Single Male Poverty
Single Male Poverty Comparison
Immigrants from Sudan
Norwegians
12.7%
SINGLE MALE POVERTY
58.2/ 100
METRIC RATING
167th/ 347
METRIC RANK
12.9%
SINGLE MALE POVERTY
32.0/ 100
METRIC RATING
185th/ 347
METRIC RANK
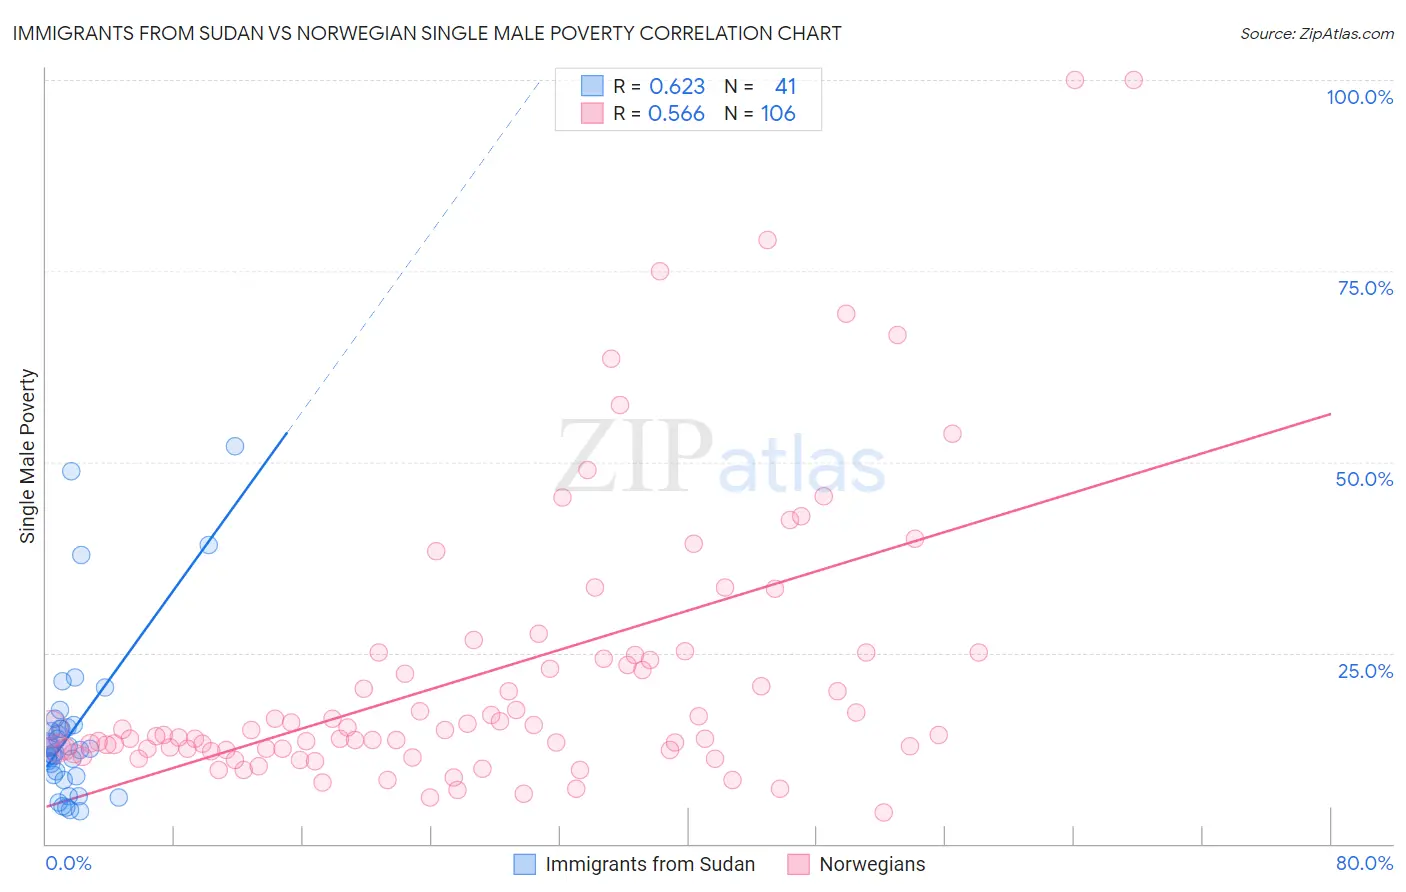
Immigrants from Sudan vs Norwegian Single Male Poverty Correlation Chart
The statistical analysis conducted on geographies consisting of 114,680,115 people shows a significant positive correlation between the proportion of Immigrants from Sudan and poverty level among single males in the United States with a correlation coefficient (R) of 0.623 and weighted average of 12.7%. Similarly, the statistical analysis conducted on geographies consisting of 445,954,160 people shows a substantial positive correlation between the proportion of Norwegians and poverty level among single males in the United States with a correlation coefficient (R) of 0.566 and weighted average of 12.9%, a difference of 1.4%.
Single Male Poverty Correlation Summary
| Measurement | Immigrants from Sudan | Norwegian |
| Minimum | 4.2% | 4.2% |
| Maximum | 52.0% | 100.0% |
| Range | 47.8% | 95.8% |
| Mean | 14.9% | 22.4% |
| Median | 12.5% | 14.6% |
| Interquartile 25% (IQ1) | 8.9% | 12.4% |
| Interquartile 75% (IQ3) | 15.4% | 24.7% |
| Interquartile Range (IQR) | 6.5% | 12.3% |
| Standard Deviation (Sample) | 10.9% | 18.9% |
| Standard Deviation (Population) | 10.8% | 18.8% |
Demographics Similar to Immigrants from Sudan and Norwegians by Single Male Poverty
In terms of single male poverty, the demographic groups most similar to Immigrants from Sudan are Immigrants from Barbados (12.7%, a difference of 0.030%), Immigrants from Guyana (12.7%, a difference of 0.13%), Puget Sound Salish (12.8%, a difference of 0.21%), Guyanese (12.8%, a difference of 0.33%), and South African (12.8%, a difference of 0.36%). Similarly, the demographic groups most similar to Norwegians are Nigerian (12.9%, a difference of 0.0%), Immigrants from Trinidad and Tobago (12.9%, a difference of 0.030%), Immigrants from West Indies (12.9%, a difference of 0.060%), Moroccan (12.9%, a difference of 0.28%), and Panamanian (12.9%, a difference of 0.32%).
| Demographics | Rating | Rank | Single Male Poverty |
| Immigrants | Guyana | 60.5 /100 | #166 | Good 12.7% |
| Immigrants | Sudan | 58.2 /100 | #167 | Average 12.7% |
| Immigrants | Barbados | 57.7 /100 | #168 | Average 12.7% |
| Puget Sound Salish | 54.3 /100 | #169 | Average 12.8% |
| Guyanese | 52.0 /100 | #170 | Average 12.8% |
| South Africans | 51.5 /100 | #171 | Average 12.8% |
| Danes | 51.4 /100 | #172 | Average 12.8% |
| Immigrants | St. Vincent and the Grenadines | 50.9 /100 | #173 | Average 12.8% |
| Costa Ricans | 50.0 /100 | #174 | Average 12.8% |
| Croatians | 48.9 /100 | #175 | Average 12.8% |
| Syrians | 48.4 /100 | #176 | Average 12.8% |
| Immigrants | Canada | 44.8 /100 | #177 | Average 12.8% |
| Immigrants | Switzerland | 43.1 /100 | #178 | Average 12.8% |
| Israelis | 41.0 /100 | #179 | Average 12.9% |
| Immigrants | North America | 37.7 /100 | #180 | Fair 12.9% |
| Panamanians | 37.6 /100 | #181 | Fair 12.9% |
| Moroccans | 36.8 /100 | #182 | Fair 12.9% |
| Immigrants | West Indies | 33.0 /100 | #183 | Fair 12.9% |
| Immigrants | Trinidad and Tobago | 32.5 /100 | #184 | Fair 12.9% |
| Norwegians | 32.0 /100 | #185 | Fair 12.9% |
| Nigerians | 31.9 /100 | #186 | Fair 12.9% |