Immigrants from Sudan vs Immigrants from Africa GED/Equivalency
COMPARE
Immigrants from Sudan
Immigrants from Africa
GED/Equivalency
GED/Equivalency Comparison
Immigrants from Sudan
Immigrants from Africa
85.5%
GED/EQUIVALENCY
34.2/ 100
METRIC RATING
183rd/ 347
METRIC RANK
85.1%
GED/EQUIVALENCY
17.5/ 100
METRIC RATING
198th/ 347
METRIC RANK
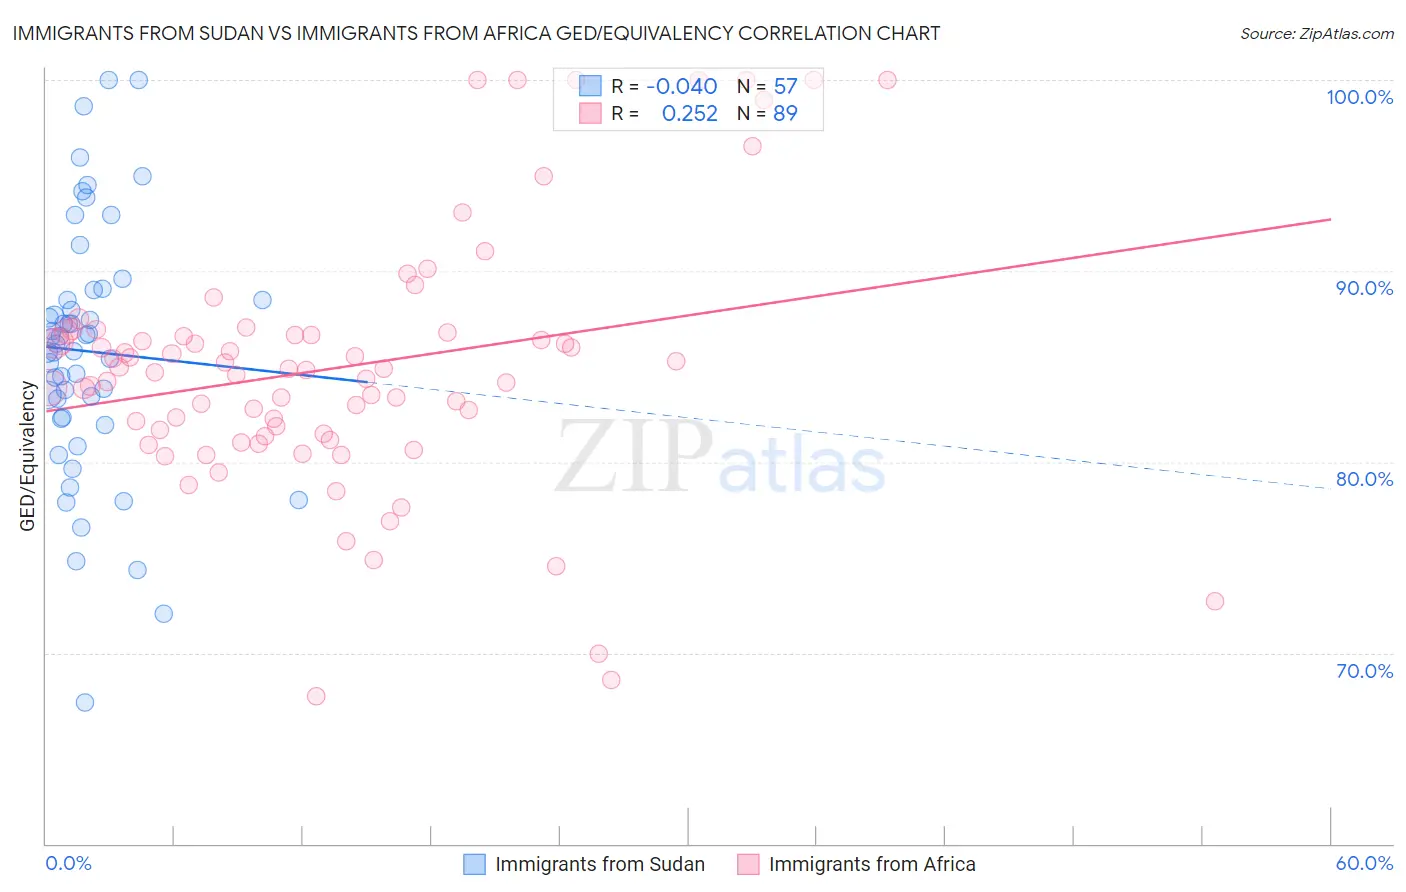
Immigrants from Sudan vs Immigrants from Africa GED/Equivalency Correlation Chart
The statistical analysis conducted on geographies consisting of 118,959,807 people shows no correlation between the proportion of Immigrants from Sudan and percentage of population with at least ged/equivalency education in the United States with a correlation coefficient (R) of -0.040 and weighted average of 85.5%. Similarly, the statistical analysis conducted on geographies consisting of 469,440,133 people shows a weak positive correlation between the proportion of Immigrants from Africa and percentage of population with at least ged/equivalency education in the United States with a correlation coefficient (R) of 0.252 and weighted average of 85.1%, a difference of 0.46%.
GED/Equivalency Correlation Summary
| Measurement | Immigrants from Sudan | Immigrants from Africa |
| Minimum | 67.4% | 67.7% |
| Maximum | 100.0% | 100.0% |
| Range | 32.6% | 32.3% |
| Mean | 85.8% | 85.0% |
| Median | 86.2% | 84.8% |
| Interquartile 25% (IQ1) | 82.3% | 81.4% |
| Interquartile 75% (IQ3) | 88.7% | 86.7% |
| Interquartile Range (IQR) | 6.4% | 5.3% |
| Standard Deviation (Sample) | 6.6% | 6.7% |
| Standard Deviation (Population) | 6.5% | 6.7% |
Demographics Similar to Immigrants from Sudan and Immigrants from Africa by GED/Equivalency
In terms of ged/equivalency, the demographic groups most similar to Immigrants from Sudan are Immigrants from Oceania (85.5%, a difference of 0.010%), Sudanese (85.5%, a difference of 0.020%), Spanish (85.4%, a difference of 0.030%), Spaniard (85.4%, a difference of 0.050%), and Moroccan (85.5%, a difference of 0.080%). Similarly, the demographic groups most similar to Immigrants from Africa are Somali (85.0%, a difference of 0.040%), Uruguayan (85.0%, a difference of 0.060%), Costa Rican (85.2%, a difference of 0.10%), Puget Sound Salish (85.2%, a difference of 0.11%), and Chippewa (85.2%, a difference of 0.11%).
| Demographics | Rating | Rank | GED/Equivalency |
| Immigrants | Southern Europe | 38.4 /100 | #180 | Fair 85.5% |
| Moroccans | 37.7 /100 | #181 | Fair 85.5% |
| Sudanese | 35.2 /100 | #182 | Fair 85.5% |
| Immigrants | Sudan | 34.2 /100 | #183 | Fair 85.5% |
| Immigrants | Oceania | 33.6 /100 | #184 | Fair 85.5% |
| Spanish | 32.8 /100 | #185 | Fair 85.4% |
| Spaniards | 31.9 /100 | #186 | Fair 85.4% |
| Immigrants | Afghanistan | 29.8 /100 | #187 | Fair 85.4% |
| Immigrants | Sierra Leone | 29.0 /100 | #188 | Fair 85.4% |
| Guamanians/Chamorros | 28.4 /100 | #189 | Fair 85.3% |
| Alaskan Athabascans | 27.5 /100 | #190 | Fair 85.3% |
| South American Indians | 22.8 /100 | #191 | Fair 85.2% |
| Immigrants | Nonimmigrants | 22.7 /100 | #192 | Fair 85.2% |
| Delaware | 22.2 /100 | #193 | Fair 85.2% |
| Puget Sound Salish | 20.8 /100 | #194 | Fair 85.2% |
| Chippewa | 20.8 /100 | #195 | Fair 85.2% |
| Tongans | 20.7 /100 | #196 | Fair 85.2% |
| Costa Ricans | 20.4 /100 | #197 | Fair 85.2% |
| Immigrants | Africa | 17.5 /100 | #198 | Poor 85.1% |
| Somalis | 16.4 /100 | #199 | Poor 85.0% |
| Uruguayans | 16.0 /100 | #200 | Poor 85.0% |