Immigrants from Sudan vs Immigrants from Ecuador GED/Equivalency
COMPARE
Immigrants from Sudan
Immigrants from Ecuador
GED/Equivalency
GED/Equivalency Comparison
Immigrants from Sudan
Immigrants from Ecuador
85.5%
GED/EQUIVALENCY
34.2/ 100
METRIC RATING
183rd/ 347
METRIC RANK
81.0%
GED/EQUIVALENCY
0.0/ 100
METRIC RATING
309th/ 347
METRIC RANK
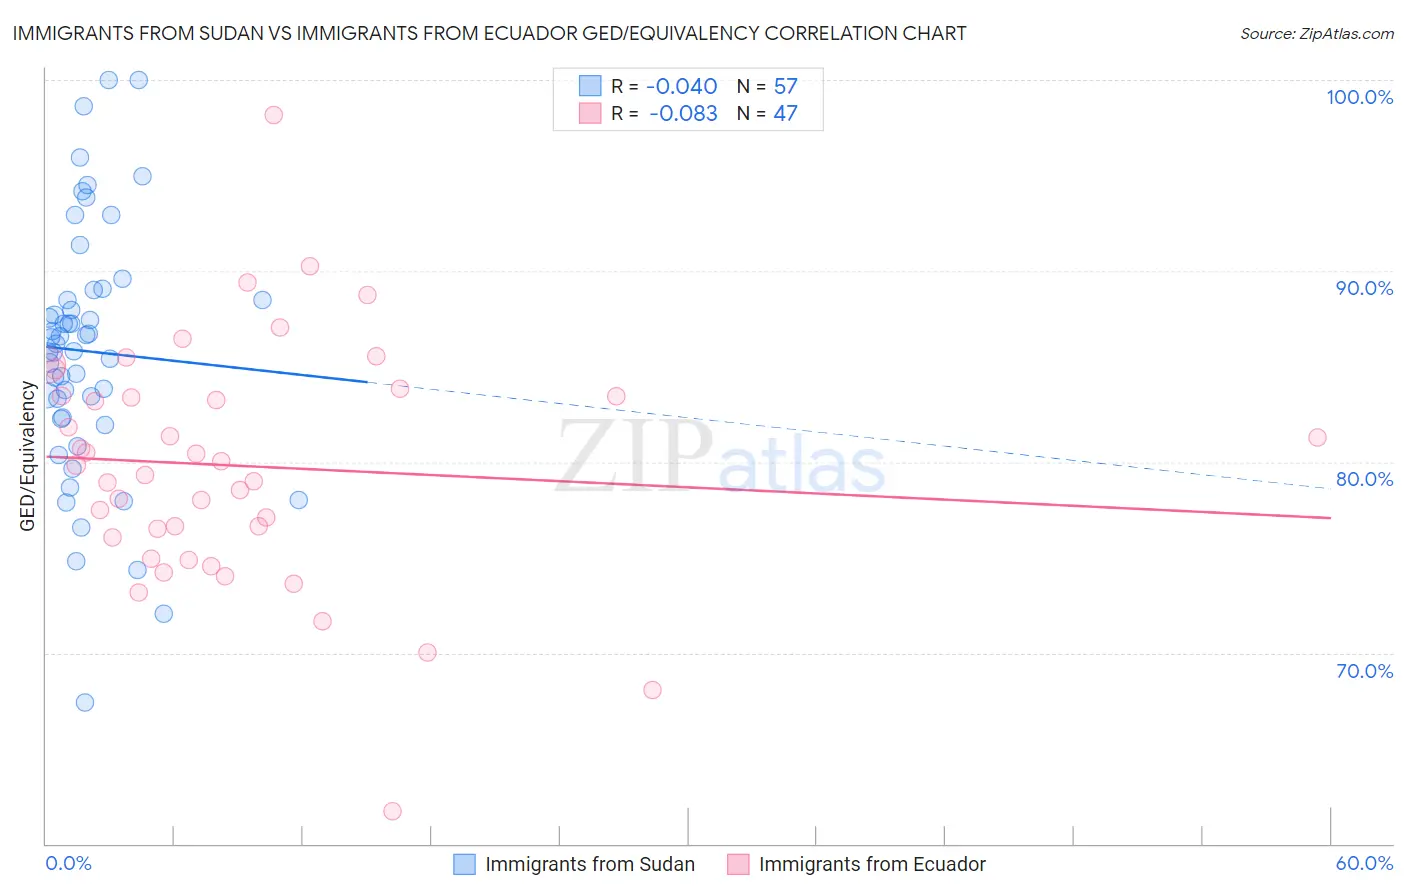
Immigrants from Sudan vs Immigrants from Ecuador GED/Equivalency Correlation Chart
The statistical analysis conducted on geographies consisting of 118,959,807 people shows no correlation between the proportion of Immigrants from Sudan and percentage of population with at least ged/equivalency education in the United States with a correlation coefficient (R) of -0.040 and weighted average of 85.5%. Similarly, the statistical analysis conducted on geographies consisting of 271,020,679 people shows a slight negative correlation between the proportion of Immigrants from Ecuador and percentage of population with at least ged/equivalency education in the United States with a correlation coefficient (R) of -0.083 and weighted average of 81.0%, a difference of 5.5%.
GED/Equivalency Correlation Summary
| Measurement | Immigrants from Sudan | Immigrants from Ecuador |
| Minimum | 67.4% | 61.7% |
| Maximum | 100.0% | 98.2% |
| Range | 32.6% | 36.5% |
| Mean | 85.8% | 79.8% |
| Median | 86.2% | 79.8% |
| Interquartile 25% (IQ1) | 82.3% | 76.0% |
| Interquartile 75% (IQ3) | 88.7% | 83.5% |
| Interquartile Range (IQR) | 6.4% | 7.5% |
| Standard Deviation (Sample) | 6.6% | 6.3% |
| Standard Deviation (Population) | 6.5% | 6.3% |
Similar Demographics by GED/Equivalency
Demographics Similar to Immigrants from Sudan by GED/Equivalency
In terms of ged/equivalency, the demographic groups most similar to Immigrants from Sudan are Immigrants from Oceania (85.5%, a difference of 0.010%), Sudanese (85.5%, a difference of 0.020%), Spanish (85.4%, a difference of 0.030%), Spaniard (85.4%, a difference of 0.050%), and Moroccan (85.5%, a difference of 0.080%).
| Demographics | Rating | Rank | GED/Equivalency |
| Immigrants | Eastern Africa | 47.7 /100 | #176 | Average 85.7% |
| Immigrants | Uganda | 45.2 /100 | #177 | Average 85.7% |
| Koreans | 41.2 /100 | #178 | Average 85.6% |
| Aleuts | 40.5 /100 | #179 | Average 85.6% |
| Immigrants | Southern Europe | 38.4 /100 | #180 | Fair 85.5% |
| Moroccans | 37.7 /100 | #181 | Fair 85.5% |
| Sudanese | 35.2 /100 | #182 | Fair 85.5% |
| Immigrants | Sudan | 34.2 /100 | #183 | Fair 85.5% |
| Immigrants | Oceania | 33.6 /100 | #184 | Fair 85.5% |
| Spanish | 32.8 /100 | #185 | Fair 85.4% |
| Spaniards | 31.9 /100 | #186 | Fair 85.4% |
| Immigrants | Afghanistan | 29.8 /100 | #187 | Fair 85.4% |
| Immigrants | Sierra Leone | 29.0 /100 | #188 | Fair 85.4% |
| Guamanians/Chamorros | 28.4 /100 | #189 | Fair 85.3% |
| Alaskan Athabascans | 27.5 /100 | #190 | Fair 85.3% |
Demographics Similar to Immigrants from Ecuador by GED/Equivalency
In terms of ged/equivalency, the demographic groups most similar to Immigrants from Ecuador are Immigrants from Guyana (81.0%, a difference of 0.060%), Native/Alaskan (80.9%, a difference of 0.070%), Puerto Rican (81.1%, a difference of 0.080%), Nicaraguan (80.9%, a difference of 0.10%), and Cape Verdean (80.9%, a difference of 0.10%).
| Demographics | Rating | Rank | GED/Equivalency |
| Immigrants | Haiti | 0.0 /100 | #302 | Tragic 81.6% |
| Immigrants | Portugal | 0.0 /100 | #303 | Tragic 81.6% |
| Navajo | 0.0 /100 | #304 | Tragic 81.5% |
| Immigrants | Grenada | 0.0 /100 | #305 | Tragic 81.3% |
| Guyanese | 0.0 /100 | #306 | Tragic 81.3% |
| Immigrants | Dominica | 0.0 /100 | #307 | Tragic 81.1% |
| Puerto Ricans | 0.0 /100 | #308 | Tragic 81.1% |
| Immigrants | Ecuador | 0.0 /100 | #309 | Tragic 81.0% |
| Immigrants | Guyana | 0.0 /100 | #310 | Tragic 81.0% |
| Natives/Alaskans | 0.0 /100 | #311 | Tragic 80.9% |
| Nicaraguans | 0.0 /100 | #312 | Tragic 80.9% |
| Cape Verdeans | 0.0 /100 | #313 | Tragic 80.9% |
| Belizeans | 0.0 /100 | #314 | Tragic 80.9% |
| Apache | 0.0 /100 | #315 | Tragic 80.7% |
| Central American Indians | 0.0 /100 | #316 | Tragic 80.6% |