Immigrants from Sudan vs Sierra Leonean GED/Equivalency
COMPARE
Immigrants from Sudan
Sierra Leonean
GED/Equivalency
GED/Equivalency Comparison
Immigrants from Sudan
Sierra Leoneans
85.5%
GED/EQUIVALENCY
34.2/ 100
METRIC RATING
183rd/ 347
METRIC RANK
86.0%
GED/EQUIVALENCY
61.8/ 100
METRIC RATING
168th/ 347
METRIC RANK
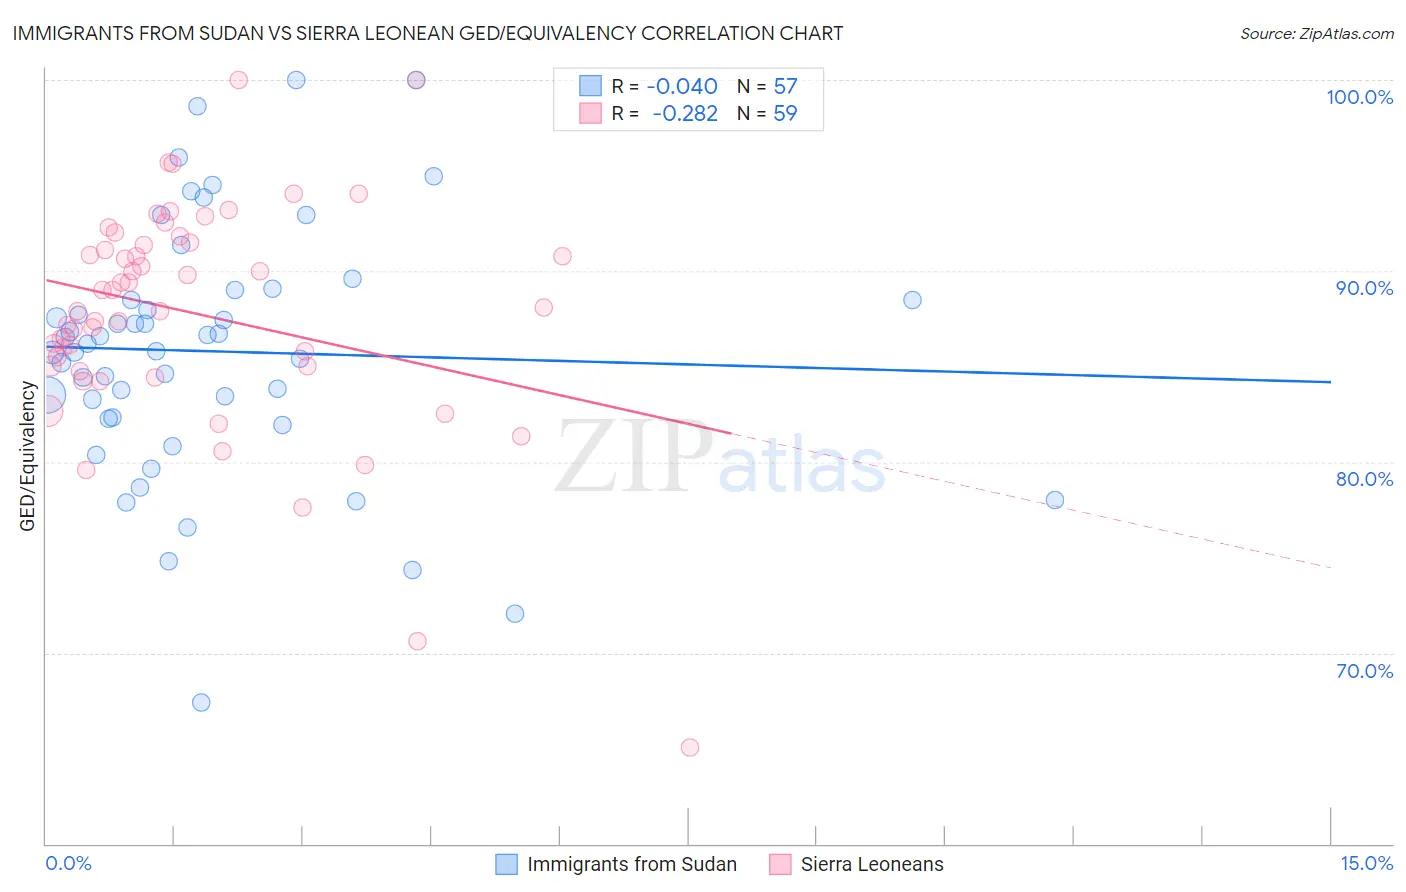
Immigrants from Sudan vs Sierra Leonean GED/Equivalency Correlation Chart
The statistical analysis conducted on geographies consisting of 118,959,807 people shows no correlation between the proportion of Immigrants from Sudan and percentage of population with at least ged/equivalency education in the United States with a correlation coefficient (R) of -0.040 and weighted average of 85.5%. Similarly, the statistical analysis conducted on geographies consisting of 83,357,120 people shows a weak negative correlation between the proportion of Sierra Leoneans and percentage of population with at least ged/equivalency education in the United States with a correlation coefficient (R) of -0.282 and weighted average of 86.0%, a difference of 0.59%.
GED/Equivalency Correlation Summary
| Measurement | Immigrants from Sudan | Sierra Leonean |
| Minimum | 67.4% | 65.0% |
| Maximum | 100.0% | 100.0% |
| Range | 32.6% | 35.0% |
| Mean | 85.8% | 87.8% |
| Median | 86.2% | 88.1% |
| Interquartile 25% (IQ1) | 82.3% | 85.0% |
| Interquartile 75% (IQ3) | 88.7% | 91.5% |
| Interquartile Range (IQR) | 6.4% | 6.5% |
| Standard Deviation (Sample) | 6.6% | 6.0% |
| Standard Deviation (Population) | 6.5% | 6.0% |
Demographics Similar to Immigrants from Sudan and Sierra Leoneans by GED/Equivalency
In terms of ged/equivalency, the demographic groups most similar to Immigrants from Sudan are Immigrants from Oceania (85.5%, a difference of 0.010%), Sudanese (85.5%, a difference of 0.020%), Spanish (85.4%, a difference of 0.030%), Moroccan (85.5%, a difference of 0.080%), and Immigrants from Southern Europe (85.5%, a difference of 0.090%). Similarly, the demographic groups most similar to Sierra Leoneans are Immigrants from Ethiopia (86.0%, a difference of 0.010%), Ethiopian (86.0%, a difference of 0.040%), Alsatian (86.0%, a difference of 0.050%), Immigrants from Albania (86.0%, a difference of 0.050%), and Afghan (85.9%, a difference of 0.050%).
| Demographics | Rating | Rank | GED/Equivalency |
| Alsatians | 64.3 /100 | #165 | Good 86.0% |
| Immigrants | Albania | 64.2 /100 | #166 | Good 86.0% |
| Ethiopians | 63.7 /100 | #167 | Good 86.0% |
| Sierra Leoneans | 61.8 /100 | #168 | Good 86.0% |
| Immigrants | Ethiopia | 61.2 /100 | #169 | Good 86.0% |
| Afghans | 59.7 /100 | #170 | Average 85.9% |
| Immigrants | Chile | 57.3 /100 | #171 | Average 85.9% |
| Bermudans | 55.1 /100 | #172 | Average 85.8% |
| Immigrants | Venezuela | 50.7 /100 | #173 | Average 85.8% |
| Ottawa | 50.0 /100 | #174 | Average 85.8% |
| Immigrants | Bolivia | 49.8 /100 | #175 | Average 85.8% |
| Immigrants | Eastern Africa | 47.7 /100 | #176 | Average 85.7% |
| Immigrants | Uganda | 45.2 /100 | #177 | Average 85.7% |
| Koreans | 41.2 /100 | #178 | Average 85.6% |
| Aleuts | 40.5 /100 | #179 | Average 85.6% |
| Immigrants | Southern Europe | 38.4 /100 | #180 | Fair 85.5% |
| Moroccans | 37.7 /100 | #181 | Fair 85.5% |
| Sudanese | 35.2 /100 | #182 | Fair 85.5% |
| Immigrants | Sudan | 34.2 /100 | #183 | Fair 85.5% |
| Immigrants | Oceania | 33.6 /100 | #184 | Fair 85.5% |
| Spanish | 32.8 /100 | #185 | Fair 85.4% |