Immigrants from Sudan vs Mexican American Indian GED/Equivalency
COMPARE
Immigrants from Sudan
Mexican American Indian
GED/Equivalency
GED/Equivalency Comparison
Immigrants from Sudan
Mexican American Indians
85.5%
GED/EQUIVALENCY
34.2/ 100
METRIC RATING
183rd/ 347
METRIC RANK
79.4%
GED/EQUIVALENCY
0.0/ 100
METRIC RATING
324th/ 347
METRIC RANK
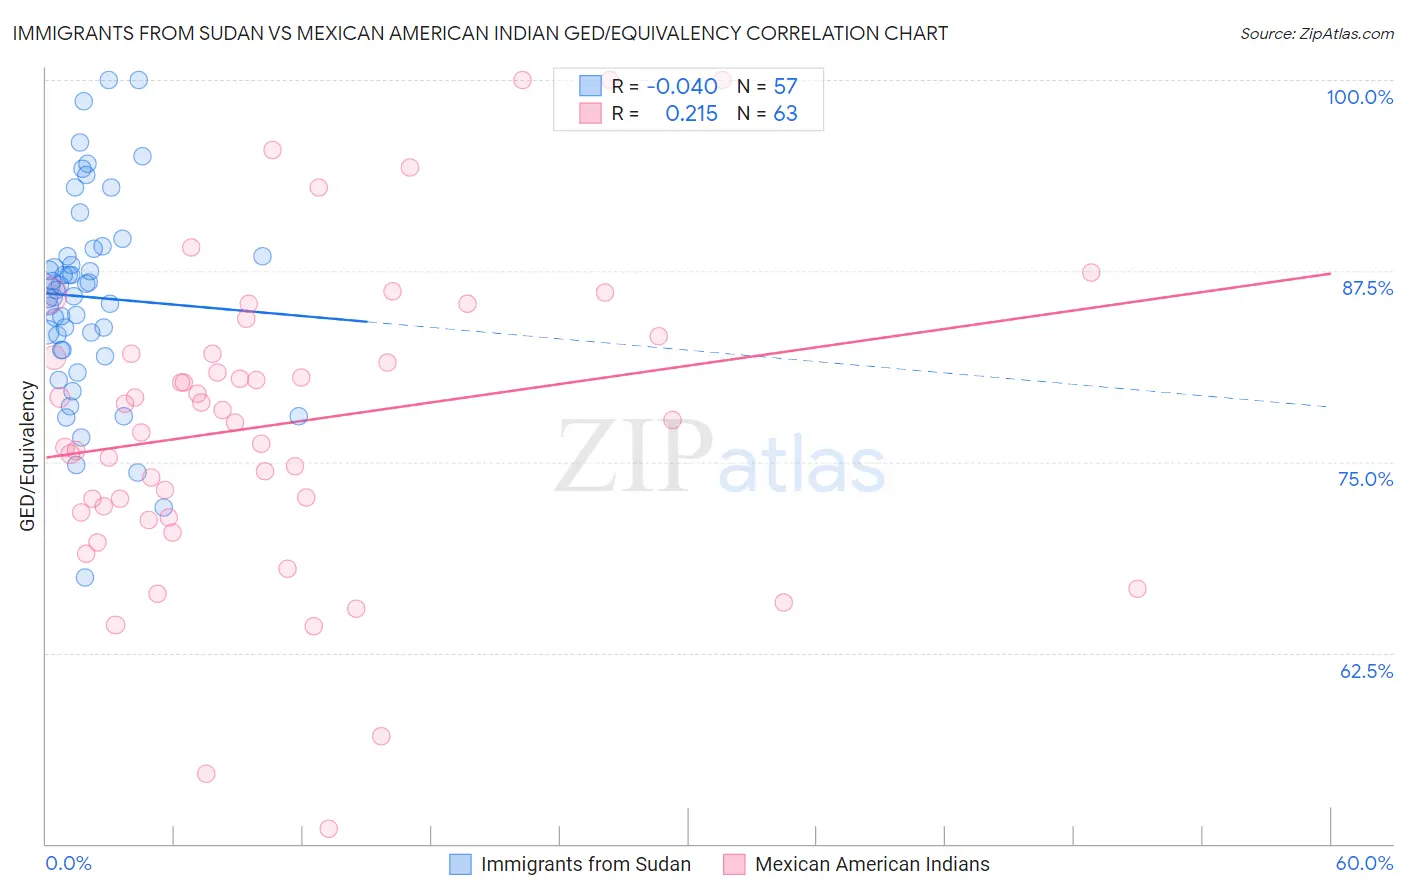
Immigrants from Sudan vs Mexican American Indian GED/Equivalency Correlation Chart
The statistical analysis conducted on geographies consisting of 118,959,807 people shows no correlation between the proportion of Immigrants from Sudan and percentage of population with at least ged/equivalency education in the United States with a correlation coefficient (R) of -0.040 and weighted average of 85.5%. Similarly, the statistical analysis conducted on geographies consisting of 317,621,155 people shows a weak positive correlation between the proportion of Mexican American Indians and percentage of population with at least ged/equivalency education in the United States with a correlation coefficient (R) of 0.215 and weighted average of 79.4%, a difference of 7.7%.
GED/Equivalency Correlation Summary
| Measurement | Immigrants from Sudan | Mexican American Indian |
| Minimum | 67.4% | 51.0% |
| Maximum | 100.0% | 100.0% |
| Range | 32.6% | 49.0% |
| Mean | 85.8% | 77.5% |
| Median | 86.2% | 77.8% |
| Interquartile 25% (IQ1) | 82.3% | 71.7% |
| Interquartile 75% (IQ3) | 88.7% | 82.1% |
| Interquartile Range (IQR) | 6.4% | 10.4% |
| Standard Deviation (Sample) | 6.6% | 10.0% |
| Standard Deviation (Population) | 6.5% | 9.9% |
Similar Demographics by GED/Equivalency
Demographics Similar to Immigrants from Sudan by GED/Equivalency
In terms of ged/equivalency, the demographic groups most similar to Immigrants from Sudan are Immigrants from Oceania (85.5%, a difference of 0.010%), Sudanese (85.5%, a difference of 0.020%), Spanish (85.4%, a difference of 0.030%), Spaniard (85.4%, a difference of 0.050%), and Moroccan (85.5%, a difference of 0.080%).
| Demographics | Rating | Rank | GED/Equivalency |
| Immigrants | Eastern Africa | 47.7 /100 | #176 | Average 85.7% |
| Immigrants | Uganda | 45.2 /100 | #177 | Average 85.7% |
| Koreans | 41.2 /100 | #178 | Average 85.6% |
| Aleuts | 40.5 /100 | #179 | Average 85.6% |
| Immigrants | Southern Europe | 38.4 /100 | #180 | Fair 85.5% |
| Moroccans | 37.7 /100 | #181 | Fair 85.5% |
| Sudanese | 35.2 /100 | #182 | Fair 85.5% |
| Immigrants | Sudan | 34.2 /100 | #183 | Fair 85.5% |
| Immigrants | Oceania | 33.6 /100 | #184 | Fair 85.5% |
| Spanish | 32.8 /100 | #185 | Fair 85.4% |
| Spaniards | 31.9 /100 | #186 | Fair 85.4% |
| Immigrants | Afghanistan | 29.8 /100 | #187 | Fair 85.4% |
| Immigrants | Sierra Leone | 29.0 /100 | #188 | Fair 85.4% |
| Guamanians/Chamorros | 28.4 /100 | #189 | Fair 85.3% |
| Alaskan Athabascans | 27.5 /100 | #190 | Fair 85.3% |
Demographics Similar to Mexican American Indians by GED/Equivalency
In terms of ged/equivalency, the demographic groups most similar to Mexican American Indians are Honduran (79.3%, a difference of 0.12%), Yuman (79.2%, a difference of 0.21%), Central American (79.2%, a difference of 0.23%), Hispanic or Latino (79.1%, a difference of 0.34%), and Dominican (79.1%, a difference of 0.38%).
| Demographics | Rating | Rank | GED/Equivalency |
| Immigrants | Caribbean | 0.0 /100 | #317 | Tragic 80.5% |
| Yaqui | 0.0 /100 | #318 | Tragic 80.5% |
| Immigrants | Belize | 0.0 /100 | #319 | Tragic 80.5% |
| Immigrants | Cuba | 0.0 /100 | #320 | Tragic 80.2% |
| Yup'ik | 0.0 /100 | #321 | Tragic 80.0% |
| Lumbee | 0.0 /100 | #322 | Tragic 80.0% |
| Immigrants | Nicaragua | 0.0 /100 | #323 | Tragic 79.9% |
| Mexican American Indians | 0.0 /100 | #324 | Tragic 79.4% |
| Hondurans | 0.0 /100 | #325 | Tragic 79.3% |
| Yuman | 0.0 /100 | #326 | Tragic 79.2% |
| Central Americans | 0.0 /100 | #327 | Tragic 79.2% |
| Hispanics or Latinos | 0.0 /100 | #328 | Tragic 79.1% |
| Dominicans | 0.0 /100 | #329 | Tragic 79.1% |
| Immigrants | Cabo Verde | 0.0 /100 | #330 | Tragic 78.9% |
| Immigrants | Honduras | 0.0 /100 | #331 | Tragic 78.7% |