Immigrants from Sudan vs Immigrants from Middle Africa GED/Equivalency
COMPARE
Immigrants from Sudan
Immigrants from Middle Africa
GED/Equivalency
GED/Equivalency Comparison
Immigrants from Sudan
Immigrants from Middle Africa
85.5%
GED/EQUIVALENCY
34.2/ 100
METRIC RATING
183rd/ 347
METRIC RANK
84.4%
GED/EQUIVALENCY
4.3/ 100
METRIC RATING
231st/ 347
METRIC RANK
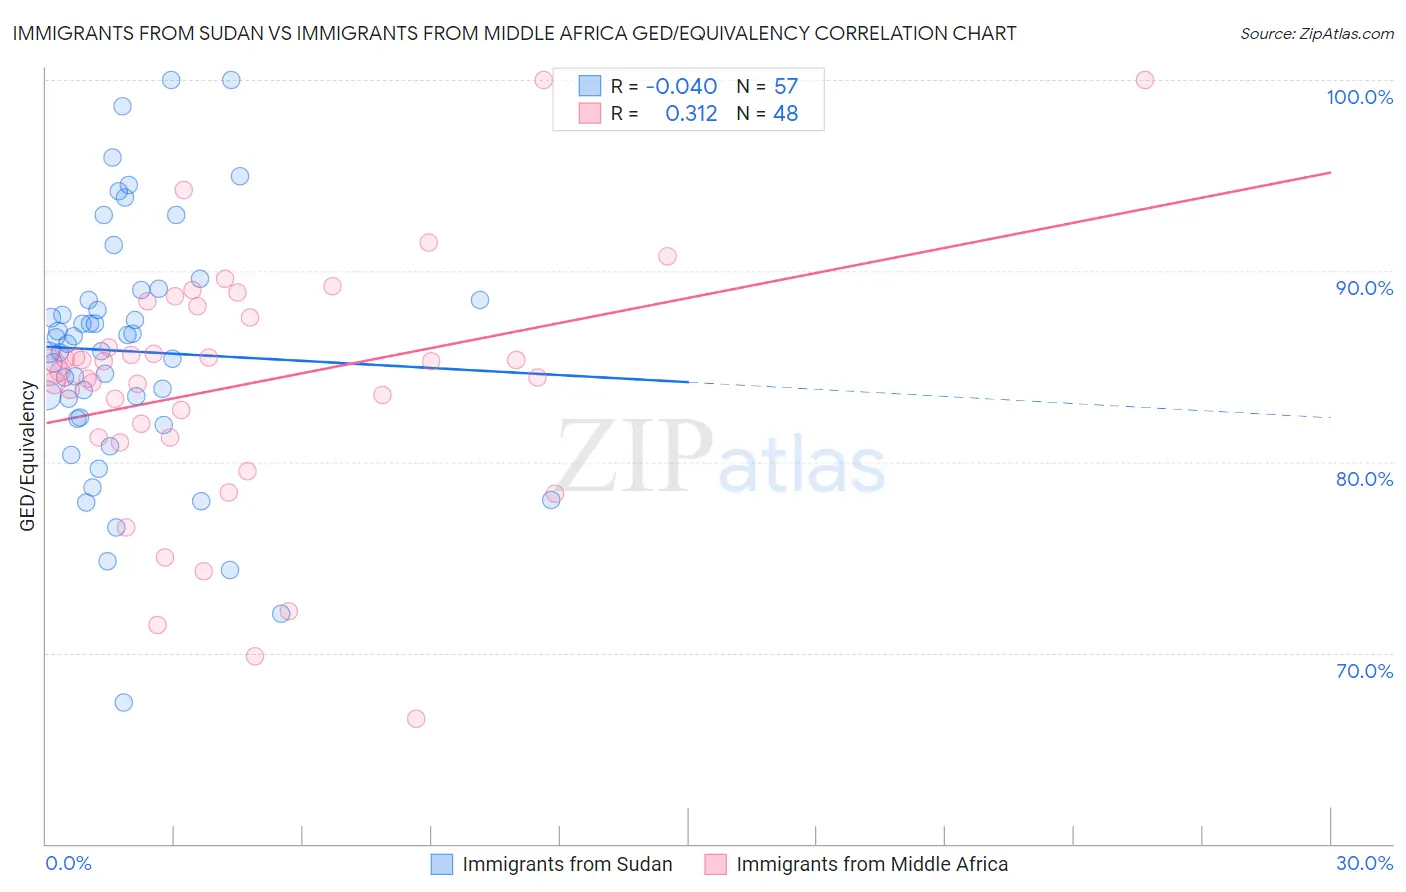
Immigrants from Sudan vs Immigrants from Middle Africa GED/Equivalency Correlation Chart
The statistical analysis conducted on geographies consisting of 118,959,807 people shows no correlation between the proportion of Immigrants from Sudan and percentage of population with at least ged/equivalency education in the United States with a correlation coefficient (R) of -0.040 and weighted average of 85.5%. Similarly, the statistical analysis conducted on geographies consisting of 202,748,536 people shows a mild positive correlation between the proportion of Immigrants from Middle Africa and percentage of population with at least ged/equivalency education in the United States with a correlation coefficient (R) of 0.312 and weighted average of 84.4%, a difference of 1.3%.
GED/Equivalency Correlation Summary
| Measurement | Immigrants from Sudan | Immigrants from Middle Africa |
| Minimum | 67.4% | 66.6% |
| Maximum | 100.0% | 100.0% |
| Range | 32.6% | 33.4% |
| Mean | 85.8% | 84.0% |
| Median | 86.2% | 84.8% |
| Interquartile 25% (IQ1) | 82.3% | 81.3% |
| Interquartile 75% (IQ3) | 88.7% | 87.9% |
| Interquartile Range (IQR) | 6.4% | 6.6% |
| Standard Deviation (Sample) | 6.6% | 6.6% |
| Standard Deviation (Population) | 6.5% | 6.6% |
Similar Demographics by GED/Equivalency
Demographics Similar to Immigrants from Sudan by GED/Equivalency
In terms of ged/equivalency, the demographic groups most similar to Immigrants from Sudan are Immigrants from Oceania (85.5%, a difference of 0.010%), Sudanese (85.5%, a difference of 0.020%), Spanish (85.4%, a difference of 0.030%), Spaniard (85.4%, a difference of 0.050%), and Moroccan (85.5%, a difference of 0.080%).
| Demographics | Rating | Rank | GED/Equivalency |
| Immigrants | Eastern Africa | 47.7 /100 | #176 | Average 85.7% |
| Immigrants | Uganda | 45.2 /100 | #177 | Average 85.7% |
| Koreans | 41.2 /100 | #178 | Average 85.6% |
| Aleuts | 40.5 /100 | #179 | Average 85.6% |
| Immigrants | Southern Europe | 38.4 /100 | #180 | Fair 85.5% |
| Moroccans | 37.7 /100 | #181 | Fair 85.5% |
| Sudanese | 35.2 /100 | #182 | Fair 85.5% |
| Immigrants | Sudan | 34.2 /100 | #183 | Fair 85.5% |
| Immigrants | Oceania | 33.6 /100 | #184 | Fair 85.5% |
| Spanish | 32.8 /100 | #185 | Fair 85.4% |
| Spaniards | 31.9 /100 | #186 | Fair 85.4% |
| Immigrants | Afghanistan | 29.8 /100 | #187 | Fair 85.4% |
| Immigrants | Sierra Leone | 29.0 /100 | #188 | Fair 85.4% |
| Guamanians/Chamorros | 28.4 /100 | #189 | Fair 85.3% |
| Alaskan Athabascans | 27.5 /100 | #190 | Fair 85.3% |
Demographics Similar to Immigrants from Middle Africa by GED/Equivalency
In terms of ged/equivalency, the demographic groups most similar to Immigrants from Middle Africa are Immigrants from South America (84.4%, a difference of 0.020%), Immigrants from Uruguay (84.4%, a difference of 0.030%), Immigrants from Colombia (84.4%, a difference of 0.030%), Immigrants from Panama (84.4%, a difference of 0.030%), and Immigrants from Liberia (84.4%, a difference of 0.070%).
| Demographics | Rating | Rank | GED/Equivalency |
| French American Indians | 6.3 /100 | #224 | Tragic 84.6% |
| Immigrants | Thailand | 5.8 /100 | #225 | Tragic 84.5% |
| Immigrants | Zaire | 5.5 /100 | #226 | Tragic 84.5% |
| Immigrants | Costa Rica | 5.4 /100 | #227 | Tragic 84.5% |
| Immigrants | Liberia | 4.9 /100 | #228 | Tragic 84.4% |
| Immigrants | Uruguay | 4.6 /100 | #229 | Tragic 84.4% |
| Immigrants | Colombia | 4.5 /100 | #230 | Tragic 84.4% |
| Immigrants | Middle Africa | 4.3 /100 | #231 | Tragic 84.4% |
| Immigrants | South America | 4.2 /100 | #232 | Tragic 84.4% |
| Immigrants | Panama | 4.1 /100 | #233 | Tragic 84.4% |
| Immigrants | Nigeria | 3.6 /100 | #234 | Tragic 84.3% |
| Ghanaians | 3.5 /100 | #235 | Tragic 84.3% |
| Immigrants | Eritrea | 3.5 /100 | #236 | Tragic 84.3% |
| Sub-Saharan Africans | 3.0 /100 | #237 | Tragic 84.2% |
| Immigrants | Peru | 2.7 /100 | #238 | Tragic 84.2% |