Immigrants from Trinidad and Tobago vs Dominican GED/Equivalency
COMPARE
Immigrants from Trinidad and Tobago
Dominican
GED/Equivalency
GED/Equivalency Comparison
Immigrants from Trinidad and Tobago
Dominicans
82.8%
GED/EQUIVALENCY
0.1/ 100
METRIC RATING
274th/ 347
METRIC RANK
79.1%
GED/EQUIVALENCY
0.0/ 100
METRIC RATING
329th/ 347
METRIC RANK
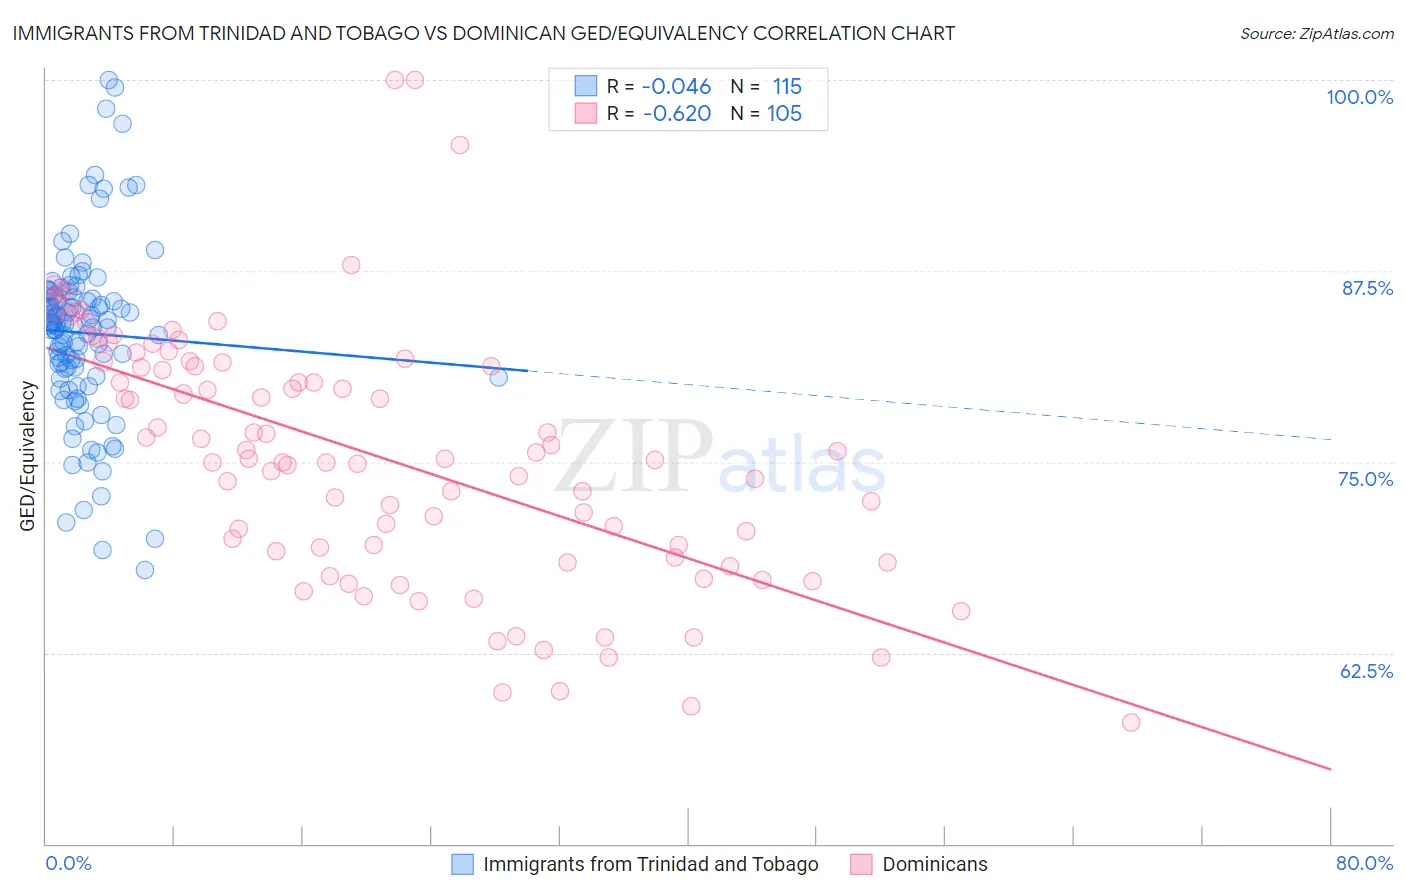
Immigrants from Trinidad and Tobago vs Dominican GED/Equivalency Correlation Chart
The statistical analysis conducted on geographies consisting of 223,527,464 people shows no correlation between the proportion of Immigrants from Trinidad and Tobago and percentage of population with at least ged/equivalency education in the United States with a correlation coefficient (R) of -0.046 and weighted average of 82.8%. Similarly, the statistical analysis conducted on geographies consisting of 355,143,187 people shows a significant negative correlation between the proportion of Dominicans and percentage of population with at least ged/equivalency education in the United States with a correlation coefficient (R) of -0.620 and weighted average of 79.1%, a difference of 4.8%.
GED/Equivalency Correlation Summary
| Measurement | Immigrants from Trinidad and Tobago | Dominican |
| Minimum | 67.9% | 58.0% |
| Maximum | 100.0% | 100.0% |
| Range | 32.1% | 42.0% |
| Mean | 83.4% | 75.3% |
| Median | 83.9% | 75.2% |
| Interquartile 25% (IQ1) | 80.6% | 69.0% |
| Interquartile 75% (IQ3) | 85.8% | 81.4% |
| Interquartile Range (IQR) | 5.2% | 12.5% |
| Standard Deviation (Sample) | 5.7% | 8.3% |
| Standard Deviation (Population) | 5.7% | 8.3% |
Similar Demographics by GED/Equivalency
Demographics Similar to Immigrants from Trinidad and Tobago by GED/Equivalency
In terms of ged/equivalency, the demographic groups most similar to Immigrants from Trinidad and Tobago are Barbadian (82.9%, a difference of 0.020%), Pennsylvania German (82.9%, a difference of 0.020%), Seminole (82.8%, a difference of 0.060%), U.S. Virgin Islander (82.9%, a difference of 0.070%), and Black/African American (82.8%, a difference of 0.080%).
| Demographics | Rating | Rank | GED/Equivalency |
| Trinidadians and Tobagonians | 0.2 /100 | #267 | Tragic 83.0% |
| Immigrants | Burma/Myanmar | 0.2 /100 | #268 | Tragic 83.0% |
| Hopi | 0.2 /100 | #269 | Tragic 83.0% |
| Immigrants | Jamaica | 0.2 /100 | #270 | Tragic 82.9% |
| U.S. Virgin Islanders | 0.2 /100 | #271 | Tragic 82.9% |
| Barbadians | 0.1 /100 | #272 | Tragic 82.9% |
| Pennsylvania Germans | 0.1 /100 | #273 | Tragic 82.9% |
| Immigrants | Trinidad and Tobago | 0.1 /100 | #274 | Tragic 82.8% |
| Seminole | 0.1 /100 | #275 | Tragic 82.8% |
| Blacks/African Americans | 0.1 /100 | #276 | Tragic 82.8% |
| Arapaho | 0.1 /100 | #277 | Tragic 82.8% |
| Immigrants | Laos | 0.1 /100 | #278 | Tragic 82.7% |
| Immigrants | Fiji | 0.1 /100 | #279 | Tragic 82.7% |
| Cheyenne | 0.1 /100 | #280 | Tragic 82.7% |
| Sioux | 0.1 /100 | #281 | Tragic 82.6% |
Demographics Similar to Dominicans by GED/Equivalency
In terms of ged/equivalency, the demographic groups most similar to Dominicans are Hispanic or Latino (79.1%, a difference of 0.050%), Central American (79.2%, a difference of 0.15%), Immigrants from Cabo Verde (78.9%, a difference of 0.16%), Yuman (79.2%, a difference of 0.17%), and Honduran (79.3%, a difference of 0.27%).
| Demographics | Rating | Rank | GED/Equivalency |
| Lumbee | 0.0 /100 | #322 | Tragic 80.0% |
| Immigrants | Nicaragua | 0.0 /100 | #323 | Tragic 79.9% |
| Mexican American Indians | 0.0 /100 | #324 | Tragic 79.4% |
| Hondurans | 0.0 /100 | #325 | Tragic 79.3% |
| Yuman | 0.0 /100 | #326 | Tragic 79.2% |
| Central Americans | 0.0 /100 | #327 | Tragic 79.2% |
| Hispanics or Latinos | 0.0 /100 | #328 | Tragic 79.1% |
| Dominicans | 0.0 /100 | #329 | Tragic 79.1% |
| Immigrants | Cabo Verde | 0.0 /100 | #330 | Tragic 78.9% |
| Immigrants | Honduras | 0.0 /100 | #331 | Tragic 78.7% |
| Immigrants | Azores | 0.0 /100 | #332 | Tragic 78.7% |
| Salvadorans | 0.0 /100 | #333 | Tragic 78.6% |
| Guatemalans | 0.0 /100 | #334 | Tragic 78.5% |
| Immigrants | Latin America | 0.0 /100 | #335 | Tragic 78.5% |
| Immigrants | Dominican Republic | 0.0 /100 | #336 | Tragic 78.0% |