Immigrants from Sierra Leone vs Dominican In Labor Force | Age 25-29
COMPARE
Immigrants from Sierra Leone
Dominican
In Labor Force | Age 25-29
In Labor Force | Age 25-29 Comparison
Immigrants from Sierra Leone
Dominicans
85.7%
IN LABOR FORCE | AGE 25-29
99.9/ 100
METRIC RATING
45th/ 347
METRIC RANK
83.2%
IN LABOR FORCE | AGE 25-29
0.0/ 100
METRIC RATING
280th/ 347
METRIC RANK
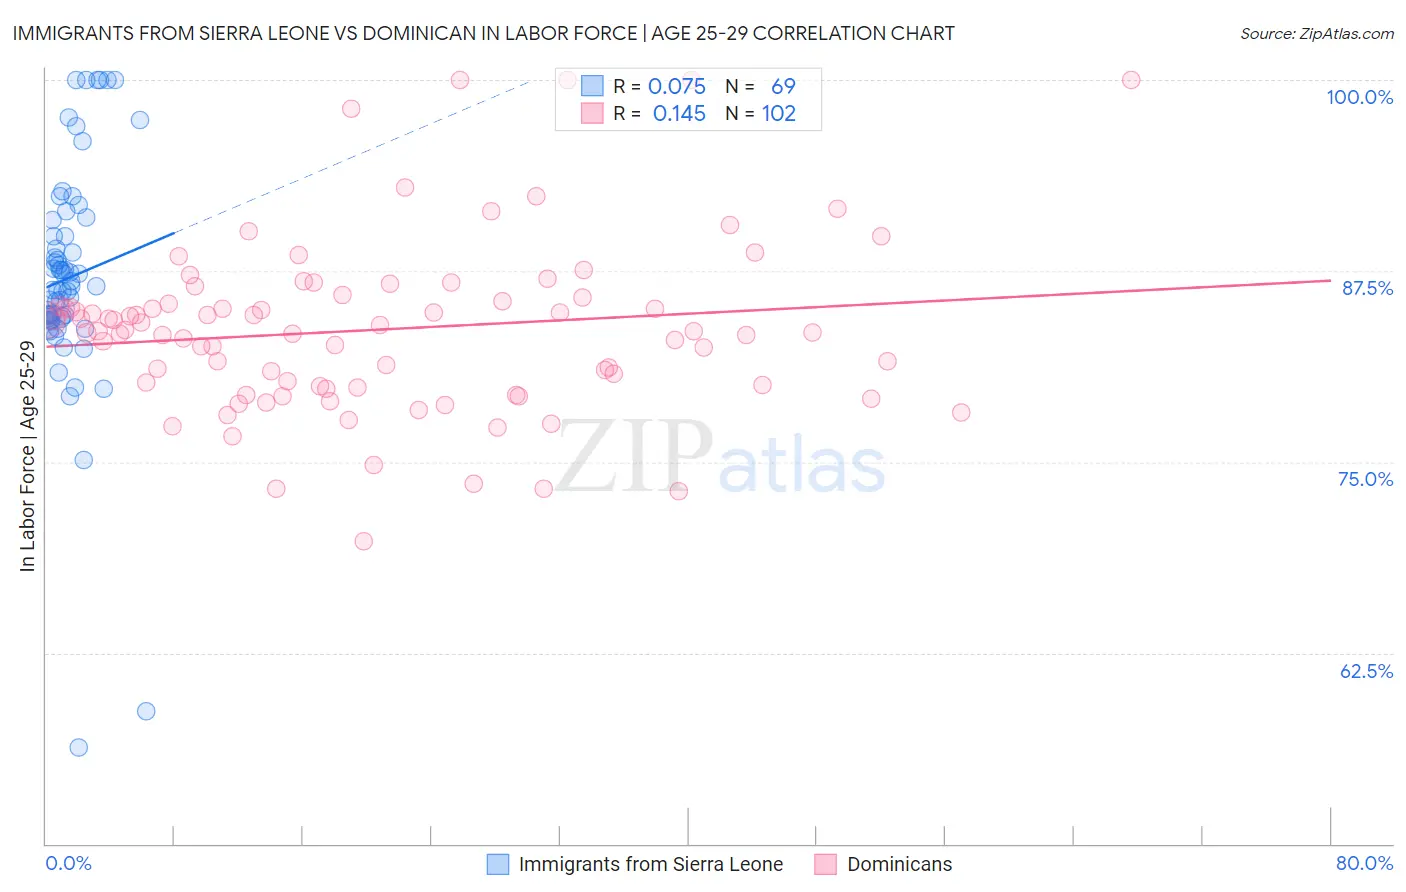
Immigrants from Sierra Leone vs Dominican In Labor Force | Age 25-29 Correlation Chart
The statistical analysis conducted on geographies consisting of 101,649,226 people shows a slight positive correlation between the proportion of Immigrants from Sierra Leone and labor force participation rate among population between the ages 25 and 29 in the United States with a correlation coefficient (R) of 0.075 and weighted average of 85.7%. Similarly, the statistical analysis conducted on geographies consisting of 355,003,122 people shows a poor positive correlation between the proportion of Dominicans and labor force participation rate among population between the ages 25 and 29 in the United States with a correlation coefficient (R) of 0.145 and weighted average of 83.2%, a difference of 3.0%.
In Labor Force | Age 25-29 Correlation Summary
| Measurement | Immigrants from Sierra Leone | Dominican |
| Minimum | 56.3% | 69.8% |
| Maximum | 100.0% | 100.0% |
| Range | 43.7% | 30.2% |
| Mean | 87.1% | 83.7% |
| Median | 86.5% | 83.6% |
| Interquartile 25% (IQ1) | 84.4% | 79.9% |
| Interquartile 75% (IQ3) | 90.3% | 85.5% |
| Interquartile Range (IQR) | 6.0% | 5.6% |
| Standard Deviation (Sample) | 7.6% | 5.6% |
| Standard Deviation (Population) | 7.5% | 5.6% |
Similar Demographics by In Labor Force | Age 25-29
Demographics Similar to Immigrants from Sierra Leone by In Labor Force | Age 25-29
In terms of in labor force | age 25-29, the demographic groups most similar to Immigrants from Sierra Leone are Macedonian (85.7%, a difference of 0.0%), Immigrants from India (85.7%, a difference of 0.010%), Immigrants from Eritrea (85.7%, a difference of 0.020%), Czech (85.6%, a difference of 0.030%), and Immigrants from Greece (85.7%, a difference of 0.060%).
| Demographics | Rating | Rank | In Labor Force | Age 25-29 |
| Sierra Leoneans | 99.9 /100 | #38 | Exceptional 85.8% |
| Croatians | 99.9 /100 | #39 | Exceptional 85.8% |
| Immigrants | Albania | 99.9 /100 | #40 | Exceptional 85.7% |
| Immigrants | Greece | 99.9 /100 | #41 | Exceptional 85.7% |
| Immigrants | Eritrea | 99.9 /100 | #42 | Exceptional 85.7% |
| Immigrants | India | 99.9 /100 | #43 | Exceptional 85.7% |
| Macedonians | 99.9 /100 | #44 | Exceptional 85.7% |
| Immigrants | Sierra Leone | 99.9 /100 | #45 | Exceptional 85.7% |
| Czechs | 99.8 /100 | #46 | Exceptional 85.6% |
| Turks | 99.8 /100 | #47 | Exceptional 85.6% |
| Italians | 99.8 /100 | #48 | Exceptional 85.6% |
| Swedes | 99.8 /100 | #49 | Exceptional 85.6% |
| Yugoslavians | 99.8 /100 | #50 | Exceptional 85.6% |
| Immigrants | Latvia | 99.8 /100 | #51 | Exceptional 85.6% |
| Immigrants | Poland | 99.7 /100 | #52 | Exceptional 85.6% |
Demographics Similar to Dominicans by In Labor Force | Age 25-29
In terms of in labor force | age 25-29, the demographic groups most similar to Dominicans are British West Indian (83.2%, a difference of 0.020%), Immigrants from Cuba (83.2%, a difference of 0.030%), Immigrants from Dominican Republic (83.1%, a difference of 0.060%), American (83.1%, a difference of 0.070%), and Immigrants from the Azores (83.1%, a difference of 0.070%).
| Demographics | Rating | Rank | In Labor Force | Age 25-29 |
| Immigrants | Dominica | 0.0 /100 | #273 | Tragic 83.4% |
| Marshallese | 0.0 /100 | #274 | Tragic 83.3% |
| Samoans | 0.0 /100 | #275 | Tragic 83.3% |
| Immigrants | Honduras | 0.0 /100 | #276 | Tragic 83.3% |
| Africans | 0.0 /100 | #277 | Tragic 83.2% |
| Immigrants | Cuba | 0.0 /100 | #278 | Tragic 83.2% |
| British West Indians | 0.0 /100 | #279 | Tragic 83.2% |
| Dominicans | 0.0 /100 | #280 | Tragic 83.2% |
| Immigrants | Dominican Republic | 0.0 /100 | #281 | Tragic 83.1% |
| Americans | 0.0 /100 | #282 | Tragic 83.1% |
| Immigrants | Azores | 0.0 /100 | #283 | Tragic 83.1% |
| Nicaraguans | 0.0 /100 | #284 | Tragic 83.1% |
| Belizeans | 0.0 /100 | #285 | Tragic 83.1% |
| Mexican American Indians | 0.0 /100 | #286 | Tragic 83.0% |
| Guyanese | 0.0 /100 | #287 | Tragic 83.0% |