Immigrants from Iraq vs Dominican GED/Equivalency
COMPARE
Immigrants from Iraq
Dominican
GED/Equivalency
GED/Equivalency Comparison
Immigrants from Iraq
Dominicans
86.1%
GED/EQUIVALENCY
68.1/ 100
METRIC RATING
162nd/ 347
METRIC RANK
79.1%
GED/EQUIVALENCY
0.0/ 100
METRIC RATING
329th/ 347
METRIC RANK
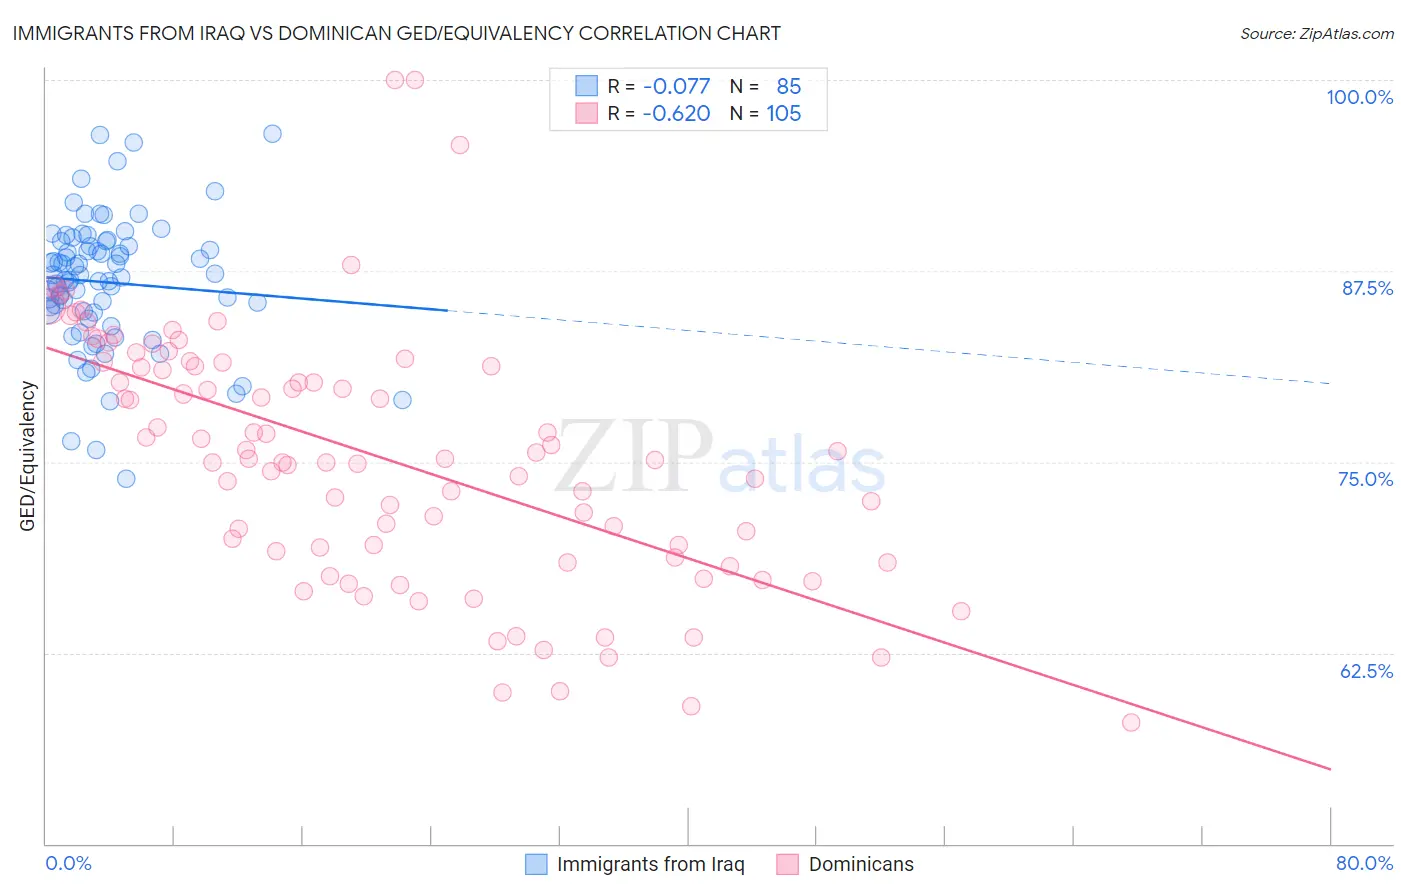
Immigrants from Iraq vs Dominican GED/Equivalency Correlation Chart
The statistical analysis conducted on geographies consisting of 194,780,026 people shows a slight negative correlation between the proportion of Immigrants from Iraq and percentage of population with at least ged/equivalency education in the United States with a correlation coefficient (R) of -0.077 and weighted average of 86.1%. Similarly, the statistical analysis conducted on geographies consisting of 355,143,187 people shows a significant negative correlation between the proportion of Dominicans and percentage of population with at least ged/equivalency education in the United States with a correlation coefficient (R) of -0.620 and weighted average of 79.1%, a difference of 8.9%.
GED/Equivalency Correlation Summary
| Measurement | Immigrants from Iraq | Dominican |
| Minimum | 73.9% | 58.0% |
| Maximum | 96.5% | 100.0% |
| Range | 22.6% | 42.0% |
| Mean | 86.7% | 75.3% |
| Median | 87.0% | 75.2% |
| Interquartile 25% (IQ1) | 84.8% | 69.0% |
| Interquartile 75% (IQ3) | 89.3% | 81.4% |
| Interquartile Range (IQR) | 4.5% | 12.5% |
| Standard Deviation (Sample) | 4.3% | 8.3% |
| Standard Deviation (Population) | 4.3% | 8.3% |
Similar Demographics by GED/Equivalency
Demographics Similar to Immigrants from Iraq by GED/Equivalency
In terms of ged/equivalency, the demographic groups most similar to Immigrants from Iraq are Immigrants from Morocco (86.1%, a difference of 0.030%), Immigrants from Syria (86.1%, a difference of 0.030%), Ugandan (86.1%, a difference of 0.040%), Venezuelan (86.0%, a difference of 0.060%), and Immigrants from Kenya (86.2%, a difference of 0.090%).
| Demographics | Rating | Rank | GED/Equivalency |
| Iraqis | 75.2 /100 | #155 | Good 86.2% |
| Immigrants | Nepal | 73.3 /100 | #156 | Good 86.2% |
| Whites/Caucasians | 72.2 /100 | #157 | Good 86.2% |
| German Russians | 72.1 /100 | #158 | Good 86.2% |
| Immigrants | Kenya | 71.8 /100 | #159 | Good 86.2% |
| Immigrants | Morocco | 69.5 /100 | #160 | Good 86.1% |
| Immigrants | Syria | 69.3 /100 | #161 | Good 86.1% |
| Immigrants | Iraq | 68.1 /100 | #162 | Good 86.1% |
| Ugandans | 66.3 /100 | #163 | Good 86.1% |
| Venezuelans | 65.5 /100 | #164 | Good 86.0% |
| Alsatians | 64.3 /100 | #165 | Good 86.0% |
| Immigrants | Albania | 64.2 /100 | #166 | Good 86.0% |
| Ethiopians | 63.7 /100 | #167 | Good 86.0% |
| Sierra Leoneans | 61.8 /100 | #168 | Good 86.0% |
| Immigrants | Ethiopia | 61.2 /100 | #169 | Good 86.0% |
Demographics Similar to Dominicans by GED/Equivalency
In terms of ged/equivalency, the demographic groups most similar to Dominicans are Hispanic or Latino (79.1%, a difference of 0.050%), Central American (79.2%, a difference of 0.15%), Immigrants from Cabo Verde (78.9%, a difference of 0.16%), Yuman (79.2%, a difference of 0.17%), and Honduran (79.3%, a difference of 0.27%).
| Demographics | Rating | Rank | GED/Equivalency |
| Lumbee | 0.0 /100 | #322 | Tragic 80.0% |
| Immigrants | Nicaragua | 0.0 /100 | #323 | Tragic 79.9% |
| Mexican American Indians | 0.0 /100 | #324 | Tragic 79.4% |
| Hondurans | 0.0 /100 | #325 | Tragic 79.3% |
| Yuman | 0.0 /100 | #326 | Tragic 79.2% |
| Central Americans | 0.0 /100 | #327 | Tragic 79.2% |
| Hispanics or Latinos | 0.0 /100 | #328 | Tragic 79.1% |
| Dominicans | 0.0 /100 | #329 | Tragic 79.1% |
| Immigrants | Cabo Verde | 0.0 /100 | #330 | Tragic 78.9% |
| Immigrants | Honduras | 0.0 /100 | #331 | Tragic 78.7% |
| Immigrants | Azores | 0.0 /100 | #332 | Tragic 78.7% |
| Salvadorans | 0.0 /100 | #333 | Tragic 78.6% |
| Guatemalans | 0.0 /100 | #334 | Tragic 78.5% |
| Immigrants | Latin America | 0.0 /100 | #335 | Tragic 78.5% |
| Immigrants | Dominican Republic | 0.0 /100 | #336 | Tragic 78.0% |