Somali vs Dominican GED/Equivalency
COMPARE
Somali
Dominican
GED/Equivalency
GED/Equivalency Comparison
Somalis
Dominicans
85.0%
GED/EQUIVALENCY
16.4/ 100
METRIC RATING
199th/ 347
METRIC RANK
79.1%
GED/EQUIVALENCY
0.0/ 100
METRIC RATING
329th/ 347
METRIC RANK
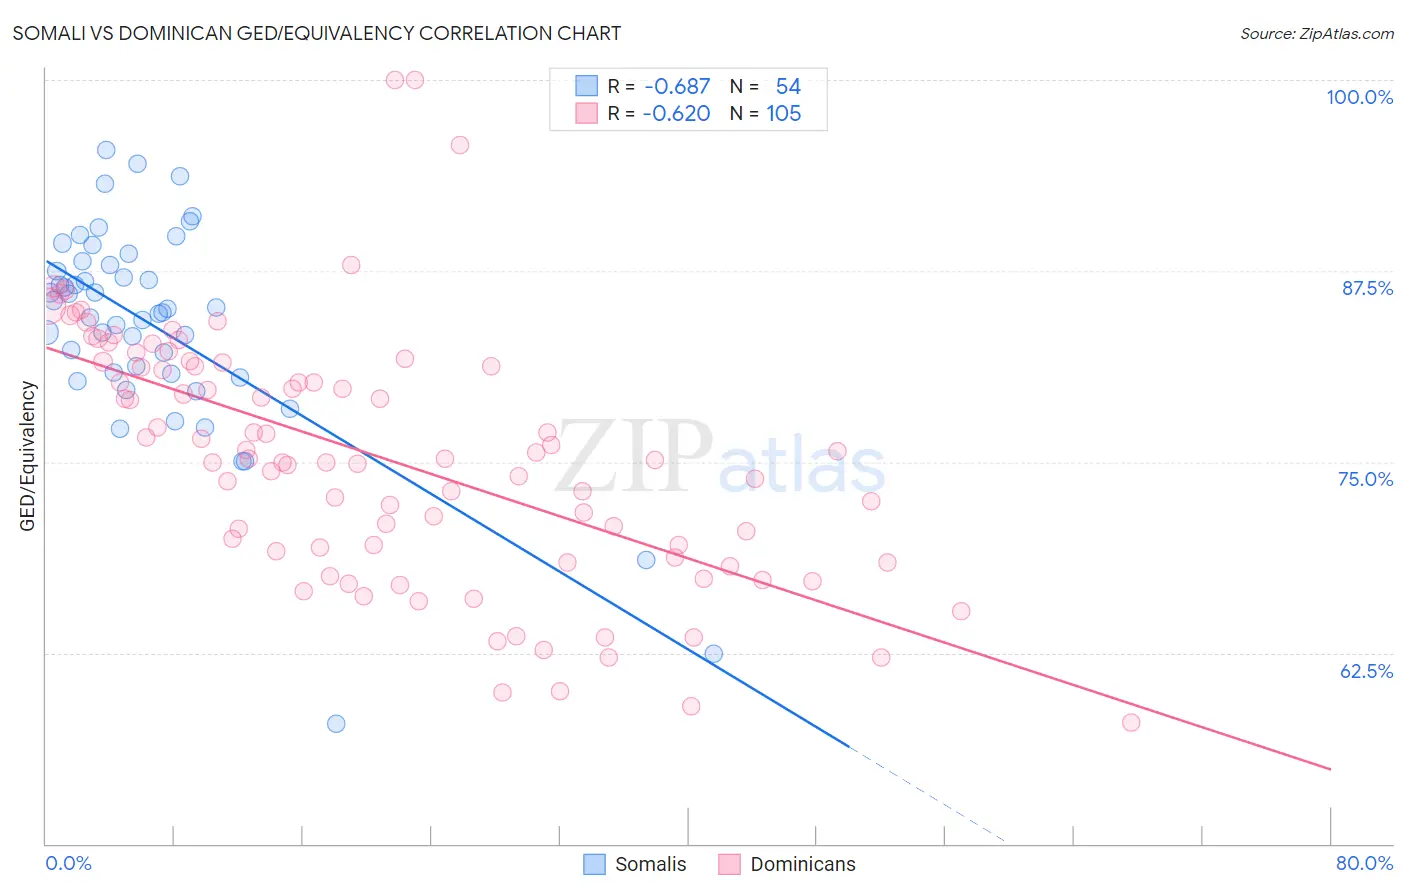
Somali vs Dominican GED/Equivalency Correlation Chart
The statistical analysis conducted on geographies consisting of 99,332,457 people shows a significant negative correlation between the proportion of Somalis and percentage of population with at least ged/equivalency education in the United States with a correlation coefficient (R) of -0.687 and weighted average of 85.0%. Similarly, the statistical analysis conducted on geographies consisting of 355,143,187 people shows a significant negative correlation between the proportion of Dominicans and percentage of population with at least ged/equivalency education in the United States with a correlation coefficient (R) of -0.620 and weighted average of 79.1%, a difference of 7.6%.
GED/Equivalency Correlation Summary
| Measurement | Somali | Dominican |
| Minimum | 57.9% | 58.0% |
| Maximum | 95.4% | 100.0% |
| Range | 37.5% | 42.0% |
| Mean | 83.8% | 75.3% |
| Median | 84.9% | 75.2% |
| Interquartile 25% (IQ1) | 80.8% | 69.0% |
| Interquartile 75% (IQ3) | 87.9% | 81.4% |
| Interquartile Range (IQR) | 7.1% | 12.5% |
| Standard Deviation (Sample) | 7.0% | 8.3% |
| Standard Deviation (Population) | 7.0% | 8.3% |
Similar Demographics by GED/Equivalency
Demographics Similar to Somalis by GED/Equivalency
In terms of ged/equivalency, the demographic groups most similar to Somalis are Uruguayan (85.0%, a difference of 0.010%), Portuguese (85.0%, a difference of 0.020%), Cree (85.0%, a difference of 0.020%), Immigrants from Africa (85.1%, a difference of 0.040%), and Panamanian (85.0%, a difference of 0.040%).
| Demographics | Rating | Rank | GED/Equivalency |
| Immigrants | Nonimmigrants | 22.7 /100 | #192 | Fair 85.2% |
| Delaware | 22.2 /100 | #193 | Fair 85.2% |
| Puget Sound Salish | 20.8 /100 | #194 | Fair 85.2% |
| Chippewa | 20.8 /100 | #195 | Fair 85.2% |
| Tongans | 20.7 /100 | #196 | Fair 85.2% |
| Costa Ricans | 20.4 /100 | #197 | Fair 85.2% |
| Immigrants | Africa | 17.5 /100 | #198 | Poor 85.1% |
| Somalis | 16.4 /100 | #199 | Poor 85.0% |
| Uruguayans | 16.0 /100 | #200 | Poor 85.0% |
| Portuguese | 15.9 /100 | #201 | Poor 85.0% |
| Cree | 15.9 /100 | #202 | Poor 85.0% |
| Panamanians | 15.3 /100 | #203 | Poor 85.0% |
| Hawaiians | 15.2 /100 | #204 | Poor 85.0% |
| Liberians | 14.6 /100 | #205 | Poor 85.0% |
| Samoans | 13.7 /100 | #206 | Poor 84.9% |
Demographics Similar to Dominicans by GED/Equivalency
In terms of ged/equivalency, the demographic groups most similar to Dominicans are Hispanic or Latino (79.1%, a difference of 0.050%), Central American (79.2%, a difference of 0.15%), Immigrants from Cabo Verde (78.9%, a difference of 0.16%), Yuman (79.2%, a difference of 0.17%), and Honduran (79.3%, a difference of 0.27%).
| Demographics | Rating | Rank | GED/Equivalency |
| Lumbee | 0.0 /100 | #322 | Tragic 80.0% |
| Immigrants | Nicaragua | 0.0 /100 | #323 | Tragic 79.9% |
| Mexican American Indians | 0.0 /100 | #324 | Tragic 79.4% |
| Hondurans | 0.0 /100 | #325 | Tragic 79.3% |
| Yuman | 0.0 /100 | #326 | Tragic 79.2% |
| Central Americans | 0.0 /100 | #327 | Tragic 79.2% |
| Hispanics or Latinos | 0.0 /100 | #328 | Tragic 79.1% |
| Dominicans | 0.0 /100 | #329 | Tragic 79.1% |
| Immigrants | Cabo Verde | 0.0 /100 | #330 | Tragic 78.9% |
| Immigrants | Honduras | 0.0 /100 | #331 | Tragic 78.7% |
| Immigrants | Azores | 0.0 /100 | #332 | Tragic 78.7% |
| Salvadorans | 0.0 /100 | #333 | Tragic 78.6% |
| Guatemalans | 0.0 /100 | #334 | Tragic 78.5% |
| Immigrants | Latin America | 0.0 /100 | #335 | Tragic 78.5% |
| Immigrants | Dominican Republic | 0.0 /100 | #336 | Tragic 78.0% |