Lithuanian vs Dominican GED/Equivalency
COMPARE
Lithuanian
Dominican
GED/Equivalency
GED/Equivalency Comparison
Lithuanians
Dominicans
88.9%
GED/EQUIVALENCY
99.9/ 100
METRIC RATING
12th/ 347
METRIC RANK
79.1%
GED/EQUIVALENCY
0.0/ 100
METRIC RATING
329th/ 347
METRIC RANK
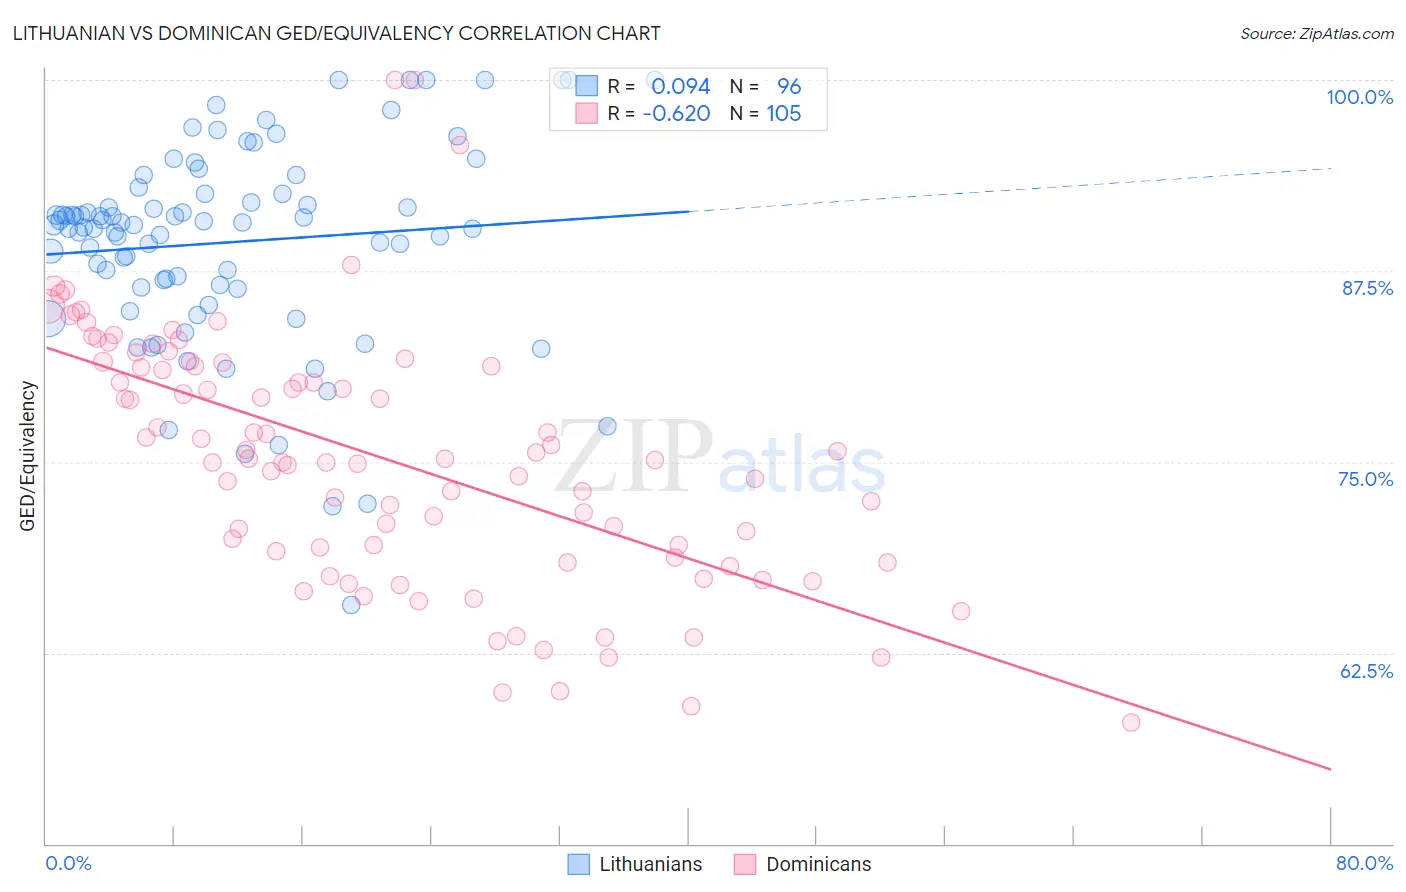
Lithuanian vs Dominican GED/Equivalency Correlation Chart
The statistical analysis conducted on geographies consisting of 421,947,832 people shows a slight positive correlation between the proportion of Lithuanians and percentage of population with at least ged/equivalency education in the United States with a correlation coefficient (R) of 0.094 and weighted average of 88.9%. Similarly, the statistical analysis conducted on geographies consisting of 355,143,187 people shows a significant negative correlation between the proportion of Dominicans and percentage of population with at least ged/equivalency education in the United States with a correlation coefficient (R) of -0.620 and weighted average of 79.1%, a difference of 12.5%.
GED/Equivalency Correlation Summary
| Measurement | Lithuanian | Dominican |
| Minimum | 65.6% | 58.0% |
| Maximum | 100.0% | 100.0% |
| Range | 34.4% | 42.0% |
| Mean | 89.4% | 75.3% |
| Median | 90.5% | 75.2% |
| Interquartile 25% (IQ1) | 86.5% | 69.0% |
| Interquartile 75% (IQ3) | 92.6% | 81.4% |
| Interquartile Range (IQR) | 6.1% | 12.5% |
| Standard Deviation (Sample) | 6.6% | 8.3% |
| Standard Deviation (Population) | 6.5% | 8.3% |
Similar Demographics by GED/Equivalency
Demographics Similar to Lithuanians by GED/Equivalency
In terms of ged/equivalency, the demographic groups most similar to Lithuanians are Immigrants from Iran (88.9%, a difference of 0.010%), Bulgarian (89.0%, a difference of 0.040%), Cypriot (88.9%, a difference of 0.040%), Okinawan (88.9%, a difference of 0.050%), and Norwegian (89.0%, a difference of 0.080%).
| Demographics | Rating | Rank | GED/Equivalency |
| Latvians | 100.0 /100 | #5 | Exceptional 89.2% |
| Thais | 100.0 /100 | #6 | Exceptional 89.1% |
| Eastern Europeans | 99.9 /100 | #7 | Exceptional 89.1% |
| Carpatho Rusyns | 99.9 /100 | #8 | Exceptional 89.1% |
| Chinese | 99.9 /100 | #9 | Exceptional 89.0% |
| Norwegians | 99.9 /100 | #10 | Exceptional 89.0% |
| Bulgarians | 99.9 /100 | #11 | Exceptional 89.0% |
| Lithuanians | 99.9 /100 | #12 | Exceptional 88.9% |
| Immigrants | Iran | 99.9 /100 | #13 | Exceptional 88.9% |
| Cypriots | 99.9 /100 | #14 | Exceptional 88.9% |
| Okinawans | 99.9 /100 | #15 | Exceptional 88.9% |
| Immigrants | Taiwan | 99.9 /100 | #16 | Exceptional 88.8% |
| Croatians | 99.9 /100 | #17 | Exceptional 88.8% |
| Slovenes | 99.9 /100 | #18 | Exceptional 88.8% |
| Swedes | 99.9 /100 | #19 | Exceptional 88.8% |
Demographics Similar to Dominicans by GED/Equivalency
In terms of ged/equivalency, the demographic groups most similar to Dominicans are Hispanic or Latino (79.1%, a difference of 0.050%), Central American (79.2%, a difference of 0.15%), Immigrants from Cabo Verde (78.9%, a difference of 0.16%), Yuman (79.2%, a difference of 0.17%), and Honduran (79.3%, a difference of 0.27%).
| Demographics | Rating | Rank | GED/Equivalency |
| Lumbee | 0.0 /100 | #322 | Tragic 80.0% |
| Immigrants | Nicaragua | 0.0 /100 | #323 | Tragic 79.9% |
| Mexican American Indians | 0.0 /100 | #324 | Tragic 79.4% |
| Hondurans | 0.0 /100 | #325 | Tragic 79.3% |
| Yuman | 0.0 /100 | #326 | Tragic 79.2% |
| Central Americans | 0.0 /100 | #327 | Tragic 79.2% |
| Hispanics or Latinos | 0.0 /100 | #328 | Tragic 79.1% |
| Dominicans | 0.0 /100 | #329 | Tragic 79.1% |
| Immigrants | Cabo Verde | 0.0 /100 | #330 | Tragic 78.9% |
| Immigrants | Honduras | 0.0 /100 | #331 | Tragic 78.7% |
| Immigrants | Azores | 0.0 /100 | #332 | Tragic 78.7% |
| Salvadorans | 0.0 /100 | #333 | Tragic 78.6% |
| Guatemalans | 0.0 /100 | #334 | Tragic 78.5% |
| Immigrants | Latin America | 0.0 /100 | #335 | Tragic 78.5% |
| Immigrants | Dominican Republic | 0.0 /100 | #336 | Tragic 78.0% |