Bahamian vs Immigrants from Liberia GED/Equivalency
COMPARE
Bahamian
Immigrants from Liberia
GED/Equivalency
GED/Equivalency Comparison
Bahamians
Immigrants from Liberia
83.6%
GED/EQUIVALENCY
0.8/ 100
METRIC RATING
252nd/ 347
METRIC RANK
84.4%
GED/EQUIVALENCY
4.9/ 100
METRIC RATING
228th/ 347
METRIC RANK
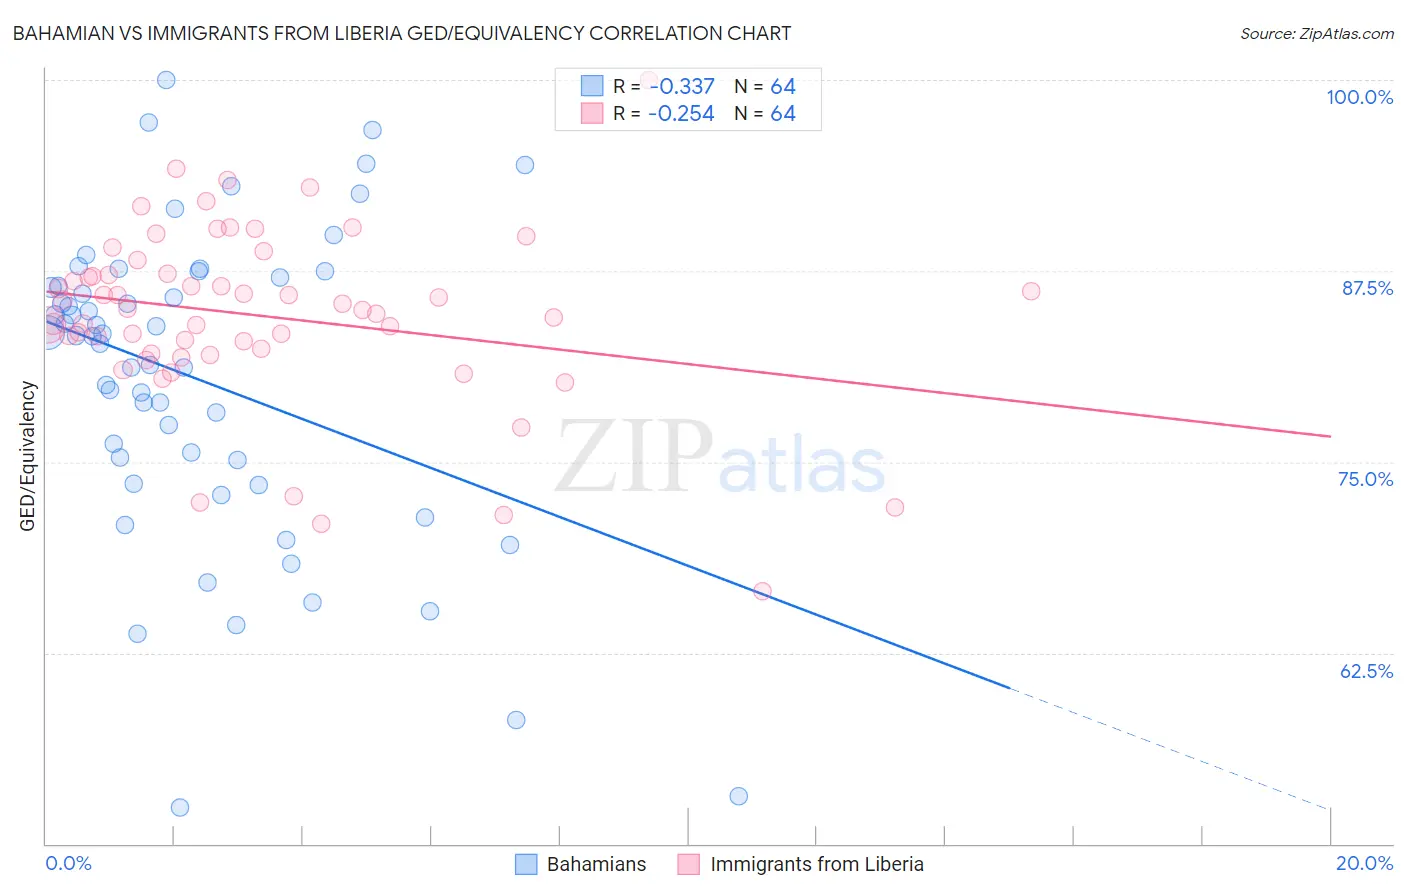
Bahamian vs Immigrants from Liberia GED/Equivalency Correlation Chart
The statistical analysis conducted on geographies consisting of 112,707,159 people shows a mild negative correlation between the proportion of Bahamians and percentage of population with at least ged/equivalency education in the United States with a correlation coefficient (R) of -0.337 and weighted average of 83.6%. Similarly, the statistical analysis conducted on geographies consisting of 135,293,967 people shows a weak negative correlation between the proportion of Immigrants from Liberia and percentage of population with at least ged/equivalency education in the United States with a correlation coefficient (R) of -0.254 and weighted average of 84.4%, a difference of 0.98%.
GED/Equivalency Correlation Summary
| Measurement | Bahamian | Immigrants from Liberia |
| Minimum | 52.4% | 66.5% |
| Maximum | 100.0% | 100.0% |
| Range | 47.6% | 33.5% |
| Mean | 80.4% | 84.5% |
| Median | 83.2% | 85.0% |
| Interquartile 25% (IQ1) | 74.4% | 82.2% |
| Interquartile 75% (IQ3) | 86.8% | 87.3% |
| Interquartile Range (IQR) | 12.5% | 5.0% |
| Standard Deviation (Sample) | 10.2% | 5.9% |
| Standard Deviation (Population) | 10.1% | 5.8% |
Similar Demographics by GED/Equivalency
Demographics Similar to Bahamians by GED/Equivalency
In terms of ged/equivalency, the demographic groups most similar to Bahamians are Spanish American (83.6%, a difference of 0.0%), Comanche (83.6%, a difference of 0.060%), Creek (83.6%, a difference of 0.090%), Shoshone (83.7%, a difference of 0.15%), and Blackfeet (83.8%, a difference of 0.17%).
| Demographics | Rating | Rank | GED/Equivalency |
| Immigrants | Senegal | 1.2 /100 | #245 | Tragic 83.8% |
| Chickasaw | 1.2 /100 | #246 | Tragic 83.8% |
| Immigrants | Western Africa | 1.1 /100 | #247 | Tragic 83.8% |
| Blackfeet | 1.1 /100 | #248 | Tragic 83.8% |
| Crow | 1.1 /100 | #249 | Tragic 83.8% |
| Shoshone | 1.0 /100 | #250 | Tragic 83.7% |
| Spanish Americans | 0.8 /100 | #251 | Tragic 83.6% |
| Bahamians | 0.8 /100 | #252 | Tragic 83.6% |
| Comanche | 0.7 /100 | #253 | Tragic 83.6% |
| Creek | 0.7 /100 | #254 | Tragic 83.6% |
| Colville | 0.5 /100 | #255 | Tragic 83.4% |
| Africans | 0.5 /100 | #256 | Tragic 83.4% |
| Jamaicans | 0.4 /100 | #257 | Tragic 83.3% |
| Malaysians | 0.4 /100 | #258 | Tragic 83.3% |
| Immigrants | Vietnam | 0.3 /100 | #259 | Tragic 83.2% |
Demographics Similar to Immigrants from Liberia by GED/Equivalency
In terms of ged/equivalency, the demographic groups most similar to Immigrants from Liberia are Immigrants from Uruguay (84.4%, a difference of 0.030%), Immigrants from Colombia (84.4%, a difference of 0.040%), Immigrants from Costa Rica (84.5%, a difference of 0.050%), Immigrants from Zaire (84.5%, a difference of 0.070%), and Immigrants from Middle Africa (84.4%, a difference of 0.070%).
| Demographics | Rating | Rank | GED/Equivalency |
| Taiwanese | 8.1 /100 | #221 | Tragic 84.7% |
| Iroquois | 7.5 /100 | #222 | Tragic 84.6% |
| Immigrants | Uzbekistan | 7.1 /100 | #223 | Tragic 84.6% |
| French American Indians | 6.3 /100 | #224 | Tragic 84.6% |
| Immigrants | Thailand | 5.8 /100 | #225 | Tragic 84.5% |
| Immigrants | Zaire | 5.5 /100 | #226 | Tragic 84.5% |
| Immigrants | Costa Rica | 5.4 /100 | #227 | Tragic 84.5% |
| Immigrants | Liberia | 4.9 /100 | #228 | Tragic 84.4% |
| Immigrants | Uruguay | 4.6 /100 | #229 | Tragic 84.4% |
| Immigrants | Colombia | 4.5 /100 | #230 | Tragic 84.4% |
| Immigrants | Middle Africa | 4.3 /100 | #231 | Tragic 84.4% |
| Immigrants | South America | 4.2 /100 | #232 | Tragic 84.4% |
| Immigrants | Panama | 4.1 /100 | #233 | Tragic 84.4% |
| Immigrants | Nigeria | 3.6 /100 | #234 | Tragic 84.3% |
| Ghanaians | 3.5 /100 | #235 | Tragic 84.3% |