Immigrants from Trinidad and Tobago vs South American Indian GED/Equivalency
COMPARE
Immigrants from Trinidad and Tobago
South American Indian
GED/Equivalency
GED/Equivalency Comparison
Immigrants from Trinidad and Tobago
South American Indians
82.8%
GED/EQUIVALENCY
0.1/ 100
METRIC RATING
274th/ 347
METRIC RANK
85.2%
GED/EQUIVALENCY
22.8/ 100
METRIC RATING
191st/ 347
METRIC RANK
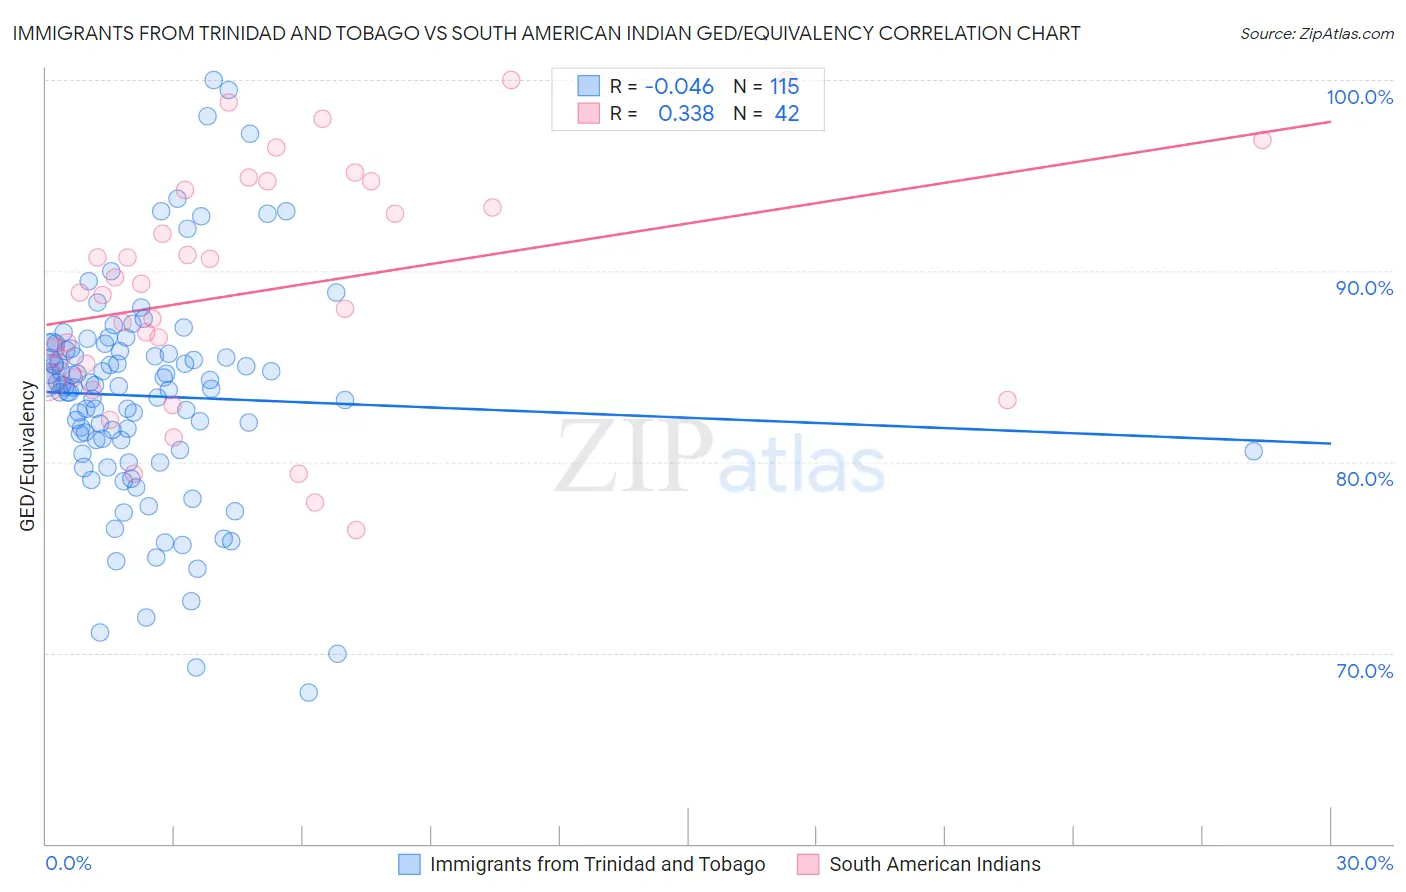
Immigrants from Trinidad and Tobago vs South American Indian GED/Equivalency Correlation Chart
The statistical analysis conducted on geographies consisting of 223,527,464 people shows no correlation between the proportion of Immigrants from Trinidad and Tobago and percentage of population with at least ged/equivalency education in the United States with a correlation coefficient (R) of -0.046 and weighted average of 82.8%. Similarly, the statistical analysis conducted on geographies consisting of 164,573,088 people shows a mild positive correlation between the proportion of South American Indians and percentage of population with at least ged/equivalency education in the United States with a correlation coefficient (R) of 0.338 and weighted average of 85.2%, a difference of 2.9%.
GED/Equivalency Correlation Summary
| Measurement | Immigrants from Trinidad and Tobago | South American Indian |
| Minimum | 67.9% | 76.5% |
| Maximum | 100.0% | 100.0% |
| Range | 32.1% | 23.5% |
| Mean | 83.4% | 88.9% |
| Median | 83.9% | 88.8% |
| Interquartile 25% (IQ1) | 80.6% | 84.4% |
| Interquartile 75% (IQ3) | 85.8% | 94.2% |
| Interquartile Range (IQR) | 5.2% | 9.8% |
| Standard Deviation (Sample) | 5.7% | 6.1% |
| Standard Deviation (Population) | 5.7% | 6.0% |
Similar Demographics by GED/Equivalency
Demographics Similar to Immigrants from Trinidad and Tobago by GED/Equivalency
In terms of ged/equivalency, the demographic groups most similar to Immigrants from Trinidad and Tobago are Barbadian (82.9%, a difference of 0.020%), Pennsylvania German (82.9%, a difference of 0.020%), Seminole (82.8%, a difference of 0.060%), U.S. Virgin Islander (82.9%, a difference of 0.070%), and Black/African American (82.8%, a difference of 0.080%).
| Demographics | Rating | Rank | GED/Equivalency |
| Trinidadians and Tobagonians | 0.2 /100 | #267 | Tragic 83.0% |
| Immigrants | Burma/Myanmar | 0.2 /100 | #268 | Tragic 83.0% |
| Hopi | 0.2 /100 | #269 | Tragic 83.0% |
| Immigrants | Jamaica | 0.2 /100 | #270 | Tragic 82.9% |
| U.S. Virgin Islanders | 0.2 /100 | #271 | Tragic 82.9% |
| Barbadians | 0.1 /100 | #272 | Tragic 82.9% |
| Pennsylvania Germans | 0.1 /100 | #273 | Tragic 82.9% |
| Immigrants | Trinidad and Tobago | 0.1 /100 | #274 | Tragic 82.8% |
| Seminole | 0.1 /100 | #275 | Tragic 82.8% |
| Blacks/African Americans | 0.1 /100 | #276 | Tragic 82.8% |
| Arapaho | 0.1 /100 | #277 | Tragic 82.8% |
| Immigrants | Laos | 0.1 /100 | #278 | Tragic 82.7% |
| Immigrants | Fiji | 0.1 /100 | #279 | Tragic 82.7% |
| Cheyenne | 0.1 /100 | #280 | Tragic 82.7% |
| Sioux | 0.1 /100 | #281 | Tragic 82.6% |
Demographics Similar to South American Indians by GED/Equivalency
In terms of ged/equivalency, the demographic groups most similar to South American Indians are Nonimmigrants (85.2%, a difference of 0.0%), Delaware (85.2%, a difference of 0.020%), Puget Sound Salish (85.2%, a difference of 0.060%), Chippewa (85.2%, a difference of 0.060%), and Tongan (85.2%, a difference of 0.060%).
| Demographics | Rating | Rank | GED/Equivalency |
| Immigrants | Oceania | 33.6 /100 | #184 | Fair 85.5% |
| Spanish | 32.8 /100 | #185 | Fair 85.4% |
| Spaniards | 31.9 /100 | #186 | Fair 85.4% |
| Immigrants | Afghanistan | 29.8 /100 | #187 | Fair 85.4% |
| Immigrants | Sierra Leone | 29.0 /100 | #188 | Fair 85.4% |
| Guamanians/Chamorros | 28.4 /100 | #189 | Fair 85.3% |
| Alaskan Athabascans | 27.5 /100 | #190 | Fair 85.3% |
| South American Indians | 22.8 /100 | #191 | Fair 85.2% |
| Immigrants | Nonimmigrants | 22.7 /100 | #192 | Fair 85.2% |
| Delaware | 22.2 /100 | #193 | Fair 85.2% |
| Puget Sound Salish | 20.8 /100 | #194 | Fair 85.2% |
| Chippewa | 20.8 /100 | #195 | Fair 85.2% |
| Tongans | 20.7 /100 | #196 | Fair 85.2% |
| Costa Ricans | 20.4 /100 | #197 | Fair 85.2% |
| Immigrants | Africa | 17.5 /100 | #198 | Poor 85.1% |