Immigrants from Morocco vs South American Indian Poverty
COMPARE
Immigrants from Morocco
South American Indian
Poverty
Poverty Comparison
Immigrants from Morocco
South American Indians
12.4%
POVERTY
44.0/ 100
METRIC RATING
179th/ 347
METRIC RANK
12.7%
POVERTY
23.3/ 100
METRIC RATING
192nd/ 347
METRIC RANK
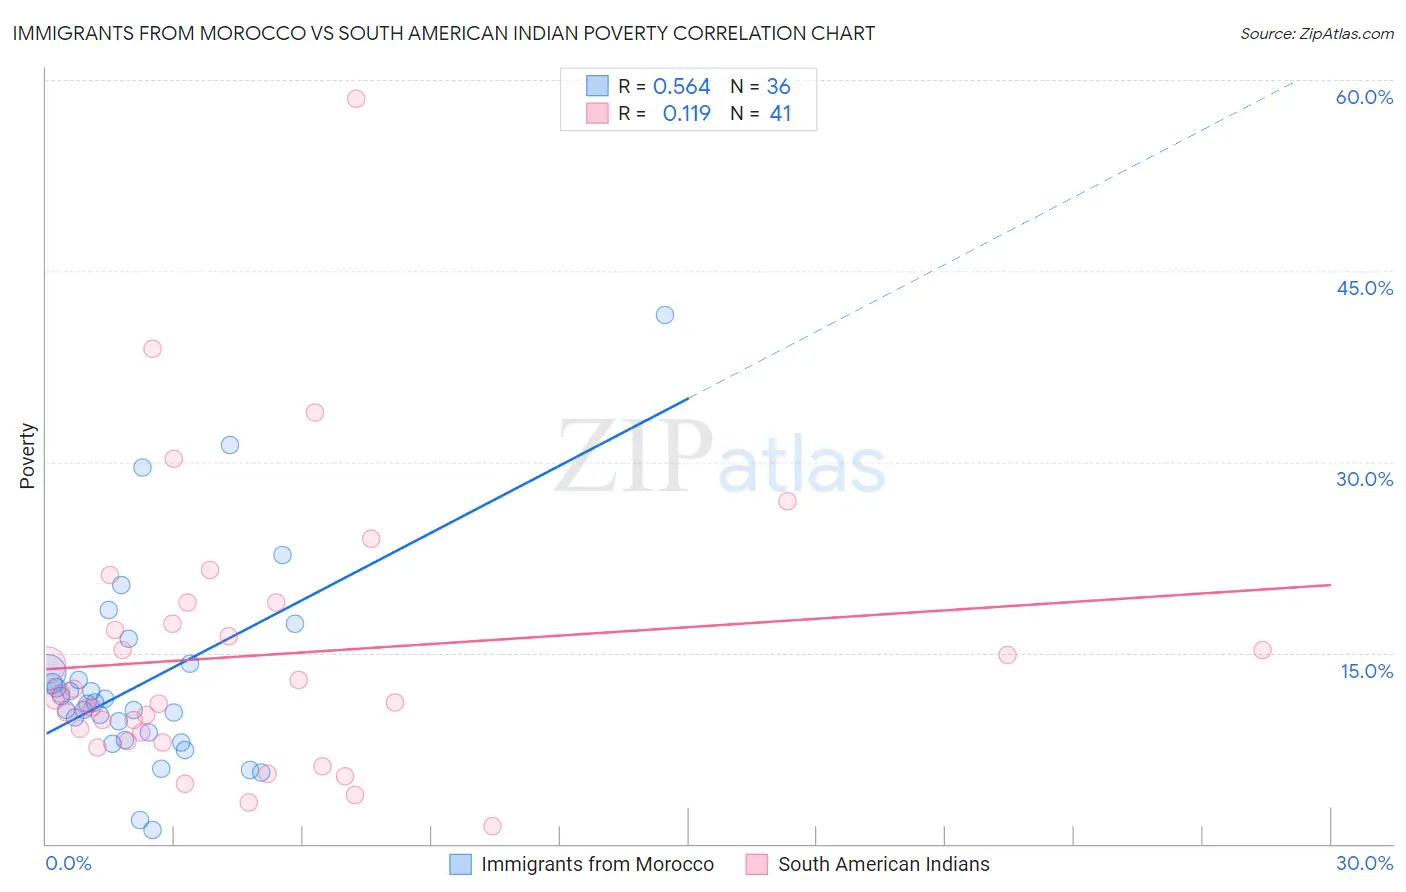
Immigrants from Morocco vs South American Indian Poverty Correlation Chart
The statistical analysis conducted on geographies consisting of 178,904,952 people shows a substantial positive correlation between the proportion of Immigrants from Morocco and poverty level in the United States with a correlation coefficient (R) of 0.564 and weighted average of 12.4%. Similarly, the statistical analysis conducted on geographies consisting of 164,528,335 people shows a poor positive correlation between the proportion of South American Indians and poverty level in the United States with a correlation coefficient (R) of 0.119 and weighted average of 12.7%, a difference of 2.3%.
Poverty Correlation Summary
| Measurement | Immigrants from Morocco | South American Indian |
| Minimum | 1.1% | 1.4% |
| Maximum | 41.6% | 58.5% |
| Range | 40.5% | 57.1% |
| Mean | 12.9% | 14.8% |
| Median | 11.1% | 11.4% |
| Interquartile 25% (IQ1) | 8.4% | 8.4% |
| Interquartile 75% (IQ3) | 13.8% | 18.2% |
| Interquartile Range (IQR) | 5.4% | 9.8% |
| Standard Deviation (Sample) | 8.0% | 10.8% |
| Standard Deviation (Population) | 7.9% | 10.6% |
Demographics Similar to Immigrants from Morocco and South American Indians by Poverty
In terms of poverty, the demographic groups most similar to Immigrants from Morocco are Mongolian (12.4%, a difference of 0.040%), Uruguayan (12.4%, a difference of 0.060%), Immigrants from Afghanistan (12.4%, a difference of 0.19%), Immigrants from Cameroon (12.4%, a difference of 0.23%), and Immigrants from Syria (12.3%, a difference of 0.33%). Similarly, the demographic groups most similar to South American Indians are Delaware (12.7%, a difference of 0.25%), Arab (12.7%, a difference of 0.29%), Immigrants from Kuwait (12.7%, a difference of 0.33%), Sierra Leonean (12.6%, a difference of 0.98%), and Immigrants from South America (12.5%, a difference of 1.1%).
| Demographics | Rating | Rank | Poverty |
| South Americans | 48.7 /100 | #175 | Average 12.3% |
| Immigrants | Colombia | 47.7 /100 | #176 | Average 12.3% |
| Immigrants | Syria | 47.5 /100 | #177 | Average 12.3% |
| Uruguayans | 44.7 /100 | #178 | Average 12.4% |
| Immigrants | Morocco | 44.0 /100 | #179 | Average 12.4% |
| Mongolians | 43.6 /100 | #180 | Average 12.4% |
| Immigrants | Afghanistan | 42.1 /100 | #181 | Average 12.4% |
| Immigrants | Cameroon | 41.7 /100 | #182 | Average 12.4% |
| Immigrants | Iraq | 40.2 /100 | #183 | Average 12.4% |
| Kenyans | 38.8 /100 | #184 | Fair 12.5% |
| Israelis | 36.4 /100 | #185 | Fair 12.5% |
| Immigrants | Sierra Leone | 36.3 /100 | #186 | Fair 12.5% |
| Hawaiians | 34.1 /100 | #187 | Fair 12.5% |
| Immigrants | Costa Rica | 33.3 /100 | #188 | Fair 12.5% |
| Aleuts | 33.2 /100 | #189 | Fair 12.5% |
| Immigrants | South America | 32.3 /100 | #190 | Fair 12.5% |
| Sierra Leoneans | 31.5 /100 | #191 | Fair 12.6% |
| South American Indians | 23.3 /100 | #192 | Fair 12.7% |
| Delaware | 21.4 /100 | #193 | Fair 12.7% |
| Arabs | 21.1 /100 | #194 | Fair 12.7% |
| Immigrants | Kuwait | 20.9 /100 | #195 | Fair 12.7% |