Immigrants from Grenada vs Immigrants from Netherlands GED/Equivalency
COMPARE
Immigrants from Grenada
Immigrants from Netherlands
GED/Equivalency
GED/Equivalency Comparison
Immigrants from Grenada
Immigrants from Netherlands
81.3%
GED/EQUIVALENCY
0.0/ 100
METRIC RATING
305th/ 347
METRIC RANK
88.0%
GED/EQUIVALENCY
99.4/ 100
METRIC RATING
51st/ 347
METRIC RANK
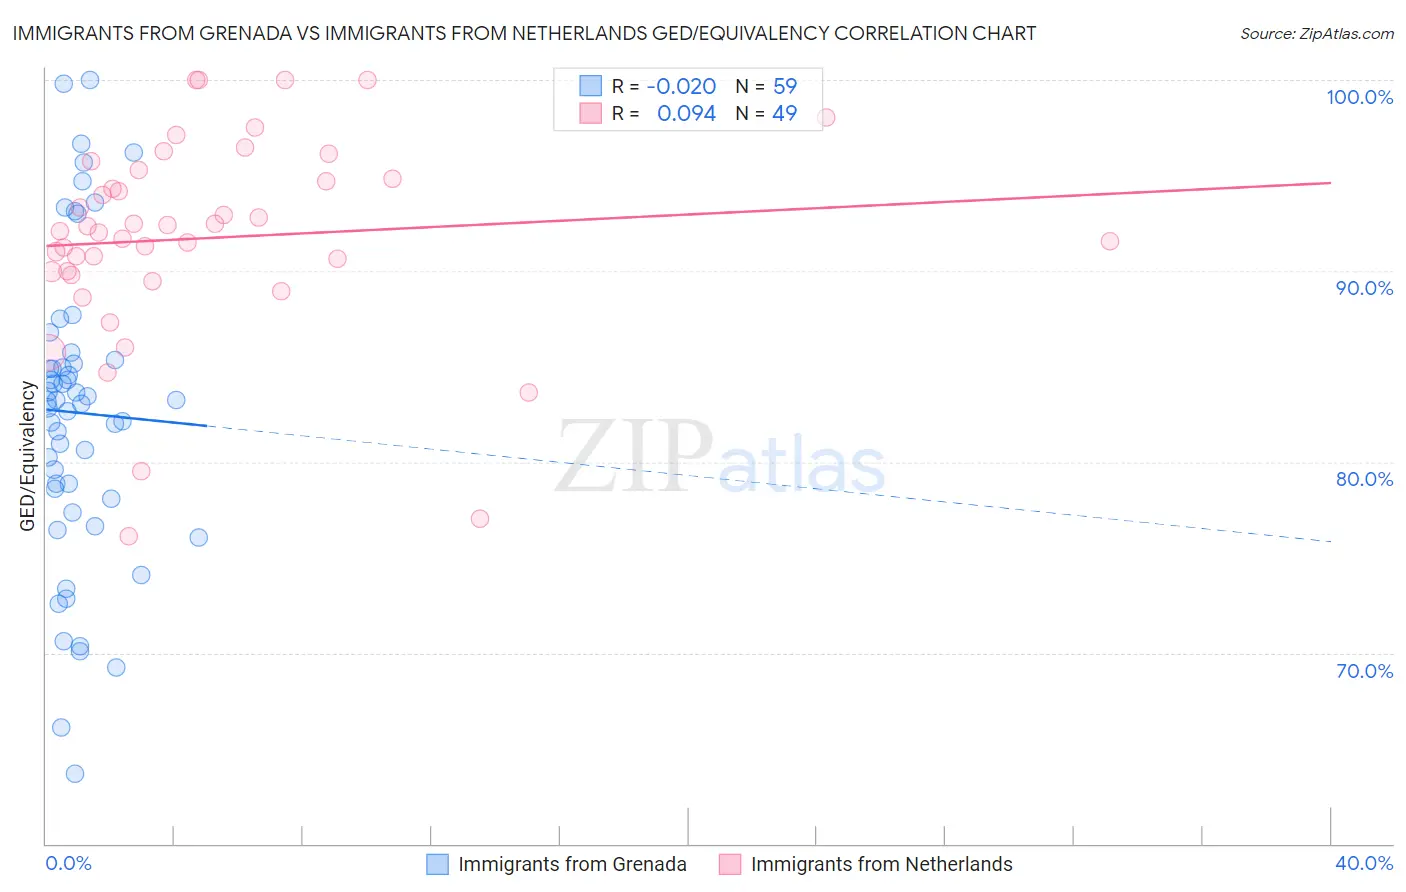
Immigrants from Grenada vs Immigrants from Netherlands GED/Equivalency Correlation Chart
The statistical analysis conducted on geographies consisting of 67,201,908 people shows no correlation between the proportion of Immigrants from Grenada and percentage of population with at least ged/equivalency education in the United States with a correlation coefficient (R) of -0.020 and weighted average of 81.3%. Similarly, the statistical analysis conducted on geographies consisting of 237,874,463 people shows a slight positive correlation between the proportion of Immigrants from Netherlands and percentage of population with at least ged/equivalency education in the United States with a correlation coefficient (R) of 0.094 and weighted average of 88.0%, a difference of 8.3%.
GED/Equivalency Correlation Summary
| Measurement | Immigrants from Grenada | Immigrants from Netherlands |
| Minimum | 63.6% | 76.1% |
| Maximum | 100.0% | 100.0% |
| Range | 36.4% | 23.9% |
| Mean | 82.6% | 91.7% |
| Median | 83.2% | 92.1% |
| Interquartile 25% (IQ1) | 78.1% | 89.9% |
| Interquartile 75% (IQ3) | 85.3% | 95.1% |
| Interquartile Range (IQR) | 7.2% | 5.2% |
| Standard Deviation (Sample) | 8.0% | 5.3% |
| Standard Deviation (Population) | 7.9% | 5.3% |
Similar Demographics by GED/Equivalency
Demographics Similar to Immigrants from Grenada by GED/Equivalency
In terms of ged/equivalency, the demographic groups most similar to Immigrants from Grenada are Guyanese (81.3%, a difference of 0.020%), Immigrants from Dominica (81.1%, a difference of 0.19%), Navajo (81.5%, a difference of 0.21%), Puerto Rican (81.1%, a difference of 0.30%), and Immigrants from Haiti (81.6%, a difference of 0.31%).
| Demographics | Rating | Rank | GED/Equivalency |
| Ute | 0.0 /100 | #298 | Tragic 81.8% |
| Ecuadorians | 0.0 /100 | #299 | Tragic 81.7% |
| Fijians | 0.0 /100 | #300 | Tragic 81.6% |
| Dutch West Indians | 0.0 /100 | #301 | Tragic 81.6% |
| Immigrants | Haiti | 0.0 /100 | #302 | Tragic 81.6% |
| Immigrants | Portugal | 0.0 /100 | #303 | Tragic 81.6% |
| Navajo | 0.0 /100 | #304 | Tragic 81.5% |
| Immigrants | Grenada | 0.0 /100 | #305 | Tragic 81.3% |
| Guyanese | 0.0 /100 | #306 | Tragic 81.3% |
| Immigrants | Dominica | 0.0 /100 | #307 | Tragic 81.1% |
| Puerto Ricans | 0.0 /100 | #308 | Tragic 81.1% |
| Immigrants | Ecuador | 0.0 /100 | #309 | Tragic 81.0% |
| Immigrants | Guyana | 0.0 /100 | #310 | Tragic 81.0% |
| Natives/Alaskans | 0.0 /100 | #311 | Tragic 80.9% |
| Nicaraguans | 0.0 /100 | #312 | Tragic 80.9% |
Demographics Similar to Immigrants from Netherlands by GED/Equivalency
In terms of ged/equivalency, the demographic groups most similar to Immigrants from Netherlands are Zimbabwean (88.0%, a difference of 0.0%), Immigrants from South Africa (88.0%, a difference of 0.0%), Soviet Union (88.0%, a difference of 0.010%), New Zealander (88.0%, a difference of 0.020%), and Immigrants from Denmark (88.0%, a difference of 0.030%).
| Demographics | Rating | Rank | GED/Equivalency |
| Macedonians | 99.5 /100 | #44 | Exceptional 88.1% |
| Czechs | 99.5 /100 | #45 | Exceptional 88.1% |
| Immigrants | Switzerland | 99.5 /100 | #46 | Exceptional 88.1% |
| Immigrants | Latvia | 99.5 /100 | #47 | Exceptional 88.1% |
| Greeks | 99.5 /100 | #48 | Exceptional 88.1% |
| Australians | 99.5 /100 | #49 | Exceptional 88.1% |
| Immigrants | Korea | 99.5 /100 | #50 | Exceptional 88.1% |
| Immigrants | Netherlands | 99.4 /100 | #51 | Exceptional 88.0% |
| Zimbabweans | 99.4 /100 | #52 | Exceptional 88.0% |
| Immigrants | South Africa | 99.4 /100 | #53 | Exceptional 88.0% |
| Soviet Union | 99.4 /100 | #54 | Exceptional 88.0% |
| New Zealanders | 99.4 /100 | #55 | Exceptional 88.0% |
| Immigrants | Denmark | 99.4 /100 | #56 | Exceptional 88.0% |
| Immigrants | Czechoslovakia | 99.3 /100 | #57 | Exceptional 87.9% |
| Northern Europeans | 99.3 /100 | #58 | Exceptional 87.9% |