Immigrants from Grenada vs Ugandan GED/Equivalency
COMPARE
Immigrants from Grenada
Ugandan
GED/Equivalency
GED/Equivalency Comparison
Immigrants from Grenada
Ugandans
81.3%
GED/EQUIVALENCY
0.0/ 100
METRIC RATING
305th/ 347
METRIC RANK
86.1%
GED/EQUIVALENCY
66.3/ 100
METRIC RATING
163rd/ 347
METRIC RANK
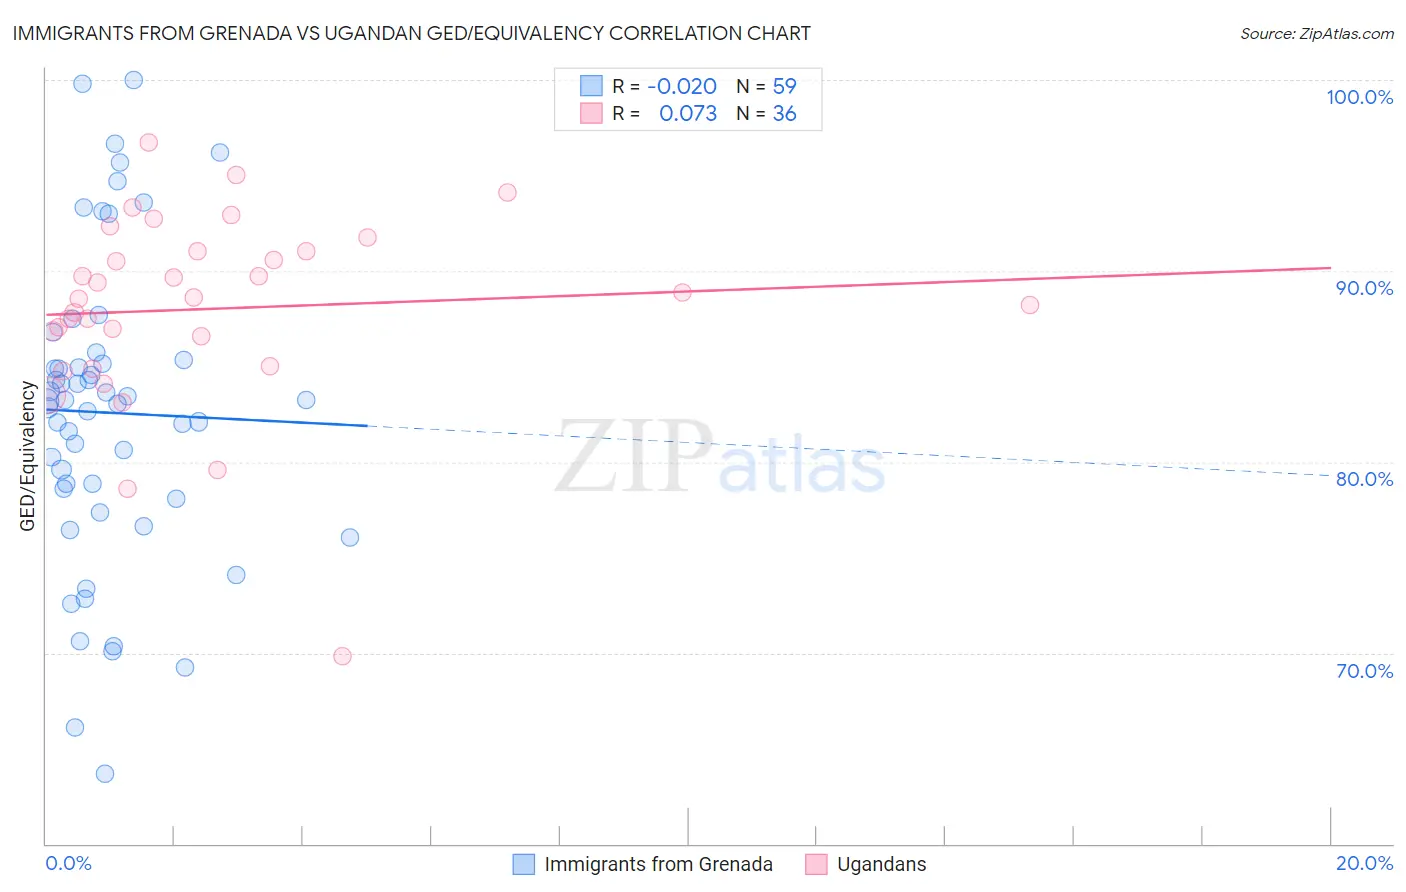
Immigrants from Grenada vs Ugandan GED/Equivalency Correlation Chart
The statistical analysis conducted on geographies consisting of 67,201,908 people shows no correlation between the proportion of Immigrants from Grenada and percentage of population with at least ged/equivalency education in the United States with a correlation coefficient (R) of -0.020 and weighted average of 81.3%. Similarly, the statistical analysis conducted on geographies consisting of 94,018,260 people shows a slight positive correlation between the proportion of Ugandans and percentage of population with at least ged/equivalency education in the United States with a correlation coefficient (R) of 0.073 and weighted average of 86.1%, a difference of 5.8%.
GED/Equivalency Correlation Summary
| Measurement | Immigrants from Grenada | Ugandan |
| Minimum | 63.6% | 69.8% |
| Maximum | 100.0% | 96.7% |
| Range | 36.4% | 26.9% |
| Mean | 82.6% | 88.0% |
| Median | 83.2% | 88.6% |
| Interquartile 25% (IQ1) | 78.1% | 85.8% |
| Interquartile 75% (IQ3) | 85.3% | 91.0% |
| Interquartile Range (IQR) | 7.2% | 5.2% |
| Standard Deviation (Sample) | 8.0% | 5.1% |
| Standard Deviation (Population) | 7.9% | 5.0% |
Similar Demographics by GED/Equivalency
Demographics Similar to Immigrants from Grenada by GED/Equivalency
In terms of ged/equivalency, the demographic groups most similar to Immigrants from Grenada are Guyanese (81.3%, a difference of 0.020%), Immigrants from Dominica (81.1%, a difference of 0.19%), Navajo (81.5%, a difference of 0.21%), Puerto Rican (81.1%, a difference of 0.30%), and Immigrants from Haiti (81.6%, a difference of 0.31%).
| Demographics | Rating | Rank | GED/Equivalency |
| Ute | 0.0 /100 | #298 | Tragic 81.8% |
| Ecuadorians | 0.0 /100 | #299 | Tragic 81.7% |
| Fijians | 0.0 /100 | #300 | Tragic 81.6% |
| Dutch West Indians | 0.0 /100 | #301 | Tragic 81.6% |
| Immigrants | Haiti | 0.0 /100 | #302 | Tragic 81.6% |
| Immigrants | Portugal | 0.0 /100 | #303 | Tragic 81.6% |
| Navajo | 0.0 /100 | #304 | Tragic 81.5% |
| Immigrants | Grenada | 0.0 /100 | #305 | Tragic 81.3% |
| Guyanese | 0.0 /100 | #306 | Tragic 81.3% |
| Immigrants | Dominica | 0.0 /100 | #307 | Tragic 81.1% |
| Puerto Ricans | 0.0 /100 | #308 | Tragic 81.1% |
| Immigrants | Ecuador | 0.0 /100 | #309 | Tragic 81.0% |
| Immigrants | Guyana | 0.0 /100 | #310 | Tragic 81.0% |
| Natives/Alaskans | 0.0 /100 | #311 | Tragic 80.9% |
| Nicaraguans | 0.0 /100 | #312 | Tragic 80.9% |
Demographics Similar to Ugandans by GED/Equivalency
In terms of ged/equivalency, the demographic groups most similar to Ugandans are Venezuelan (86.0%, a difference of 0.020%), Immigrants from Iraq (86.1%, a difference of 0.040%), Alsatian (86.0%, a difference of 0.040%), Immigrants from Albania (86.0%, a difference of 0.050%), and Ethiopian (86.0%, a difference of 0.060%).
| Demographics | Rating | Rank | GED/Equivalency |
| Immigrants | Nepal | 73.3 /100 | #156 | Good 86.2% |
| Whites/Caucasians | 72.2 /100 | #157 | Good 86.2% |
| German Russians | 72.1 /100 | #158 | Good 86.2% |
| Immigrants | Kenya | 71.8 /100 | #159 | Good 86.2% |
| Immigrants | Morocco | 69.5 /100 | #160 | Good 86.1% |
| Immigrants | Syria | 69.3 /100 | #161 | Good 86.1% |
| Immigrants | Iraq | 68.1 /100 | #162 | Good 86.1% |
| Ugandans | 66.3 /100 | #163 | Good 86.1% |
| Venezuelans | 65.5 /100 | #164 | Good 86.0% |
| Alsatians | 64.3 /100 | #165 | Good 86.0% |
| Immigrants | Albania | 64.2 /100 | #166 | Good 86.0% |
| Ethiopians | 63.7 /100 | #167 | Good 86.0% |
| Sierra Leoneans | 61.8 /100 | #168 | Good 86.0% |
| Immigrants | Ethiopia | 61.2 /100 | #169 | Good 86.0% |
| Afghans | 59.7 /100 | #170 | Average 85.9% |