Immigrants from Grenada vs Immigrants from Netherlands Kindergarten
COMPARE
Immigrants from Grenada
Immigrants from Netherlands
Kindergarten
Kindergarten Comparison
Immigrants from Grenada
Immigrants from Netherlands
97.2%
KINDERGARTEN
0.0/ 100
METRIC RATING
295th/ 347
METRIC RANK
98.3%
KINDERGARTEN
99.3/ 100
METRIC RATING
74th/ 347
METRIC RANK
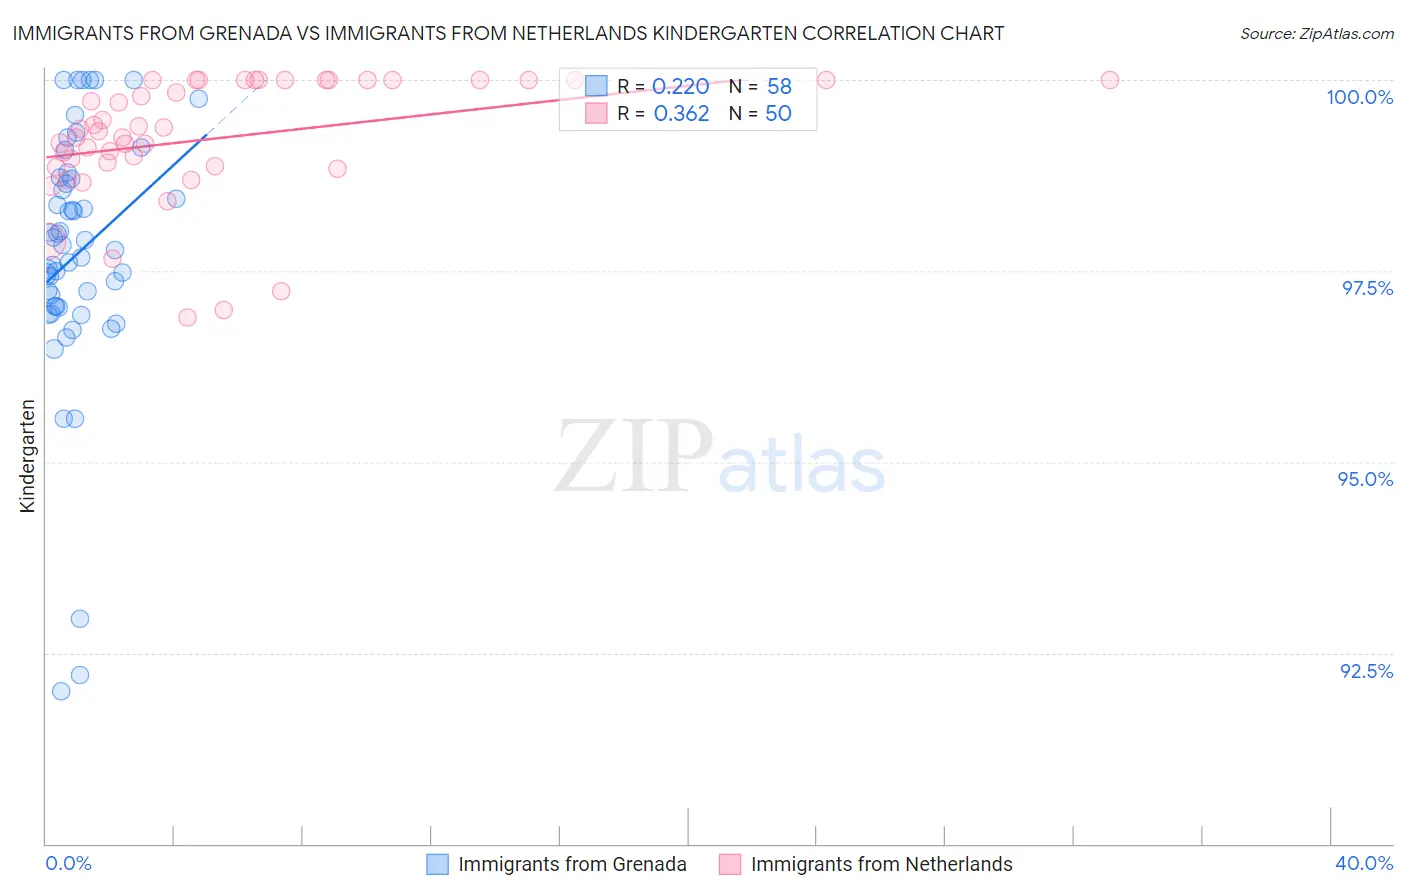
Immigrants from Grenada vs Immigrants from Netherlands Kindergarten Correlation Chart
The statistical analysis conducted on geographies consisting of 67,200,336 people shows a weak positive correlation between the proportion of Immigrants from Grenada and percentage of population with at least kindergarten education in the United States with a correlation coefficient (R) of 0.220 and weighted average of 97.2%. Similarly, the statistical analysis conducted on geographies consisting of 237,869,934 people shows a mild positive correlation between the proportion of Immigrants from Netherlands and percentage of population with at least kindergarten education in the United States with a correlation coefficient (R) of 0.362 and weighted average of 98.3%, a difference of 1.1%.
Kindergarten Correlation Summary
| Measurement | Immigrants from Grenada | Immigrants from Netherlands |
| Minimum | 92.0% | 96.9% |
| Maximum | 100.0% | 100.0% |
| Range | 8.0% | 3.1% |
| Mean | 97.7% | 99.2% |
| Median | 97.8% | 99.3% |
| Interquartile 25% (IQ1) | 97.0% | 98.9% |
| Interquartile 75% (IQ3) | 98.7% | 100.0% |
| Interquartile Range (IQR) | 1.7% | 1.1% |
| Standard Deviation (Sample) | 1.7% | 0.81% |
| Standard Deviation (Population) | 1.7% | 0.80% |
Similar Demographics by Kindergarten
Demographics Similar to Immigrants from Grenada by Kindergarten
In terms of kindergarten, the demographic groups most similar to Immigrants from Grenada are Immigrants (97.2%, a difference of 0.0%), Immigrants from Eritrea (97.2%, a difference of 0.010%), Malaysian (97.2%, a difference of 0.030%), British West Indian (97.3%, a difference of 0.040%), and Houma (97.3%, a difference of 0.050%).
| Demographics | Rating | Rank | Kindergarten |
| Immigrants | Thailand | 0.0 /100 | #288 | Tragic 97.3% |
| Immigrants | Afghanistan | 0.0 /100 | #289 | Tragic 97.3% |
| Immigrants | St. Vincent and the Grenadines | 0.0 /100 | #290 | Tragic 97.3% |
| Houma | 0.0 /100 | #291 | Tragic 97.3% |
| British West Indians | 0.0 /100 | #292 | Tragic 97.3% |
| Malaysians | 0.0 /100 | #293 | Tragic 97.2% |
| Immigrants | Immigrants | 0.0 /100 | #294 | Tragic 97.2% |
| Immigrants | Grenada | 0.0 /100 | #295 | Tragic 97.2% |
| Immigrants | Eritrea | 0.0 /100 | #296 | Tragic 97.2% |
| Central American Indians | 0.0 /100 | #297 | Tragic 97.2% |
| Immigrants | Dominica | 0.0 /100 | #298 | Tragic 97.1% |
| Immigrants | Cuba | 0.0 /100 | #299 | Tragic 97.1% |
| Haitians | 0.0 /100 | #300 | Tragic 97.1% |
| Immigrants | South Eastern Asia | 0.0 /100 | #301 | Tragic 97.1% |
| Immigrants | Caribbean | 0.0 /100 | #302 | Tragic 97.1% |
Demographics Similar to Immigrants from Netherlands by Kindergarten
In terms of kindergarten, the demographic groups most similar to Immigrants from Netherlands are Cherokee (98.3%, a difference of 0.0%), Cajun (98.3%, a difference of 0.010%), Immigrants from England (98.3%, a difference of 0.010%), Delaware (98.3%, a difference of 0.010%), and Shoshone (98.3%, a difference of 0.010%).
| Demographics | Rating | Rank | Kindergarten |
| Canadians | 99.6 /100 | #67 | Exceptional 98.4% |
| Immigrants | Northern Europe | 99.6 /100 | #68 | Exceptional 98.4% |
| Immigrants | Austria | 99.6 /100 | #69 | Exceptional 98.4% |
| Russians | 99.6 /100 | #70 | Exceptional 98.4% |
| Chickasaw | 99.6 /100 | #71 | Exceptional 98.4% |
| Serbians | 99.6 /100 | #72 | Exceptional 98.4% |
| Cajuns | 99.4 /100 | #73 | Exceptional 98.3% |
| Immigrants | Netherlands | 99.3 /100 | #74 | Exceptional 98.3% |
| Cherokee | 99.3 /100 | #75 | Exceptional 98.3% |
| Immigrants | England | 99.3 /100 | #76 | Exceptional 98.3% |
| Delaware | 99.3 /100 | #77 | Exceptional 98.3% |
| Shoshone | 99.2 /100 | #78 | Exceptional 98.3% |
| Immigrants | Belgium | 99.2 /100 | #79 | Exceptional 98.3% |
| Immigrants | Lithuania | 99.2 /100 | #80 | Exceptional 98.3% |
| Icelanders | 99.2 /100 | #81 | Exceptional 98.3% |