Immigrants from Grenada vs Guatemalan GED/Equivalency
COMPARE
Immigrants from Grenada
Guatemalan
GED/Equivalency
GED/Equivalency Comparison
Immigrants from Grenada
Guatemalans
81.3%
GED/EQUIVALENCY
0.0/ 100
METRIC RATING
305th/ 347
METRIC RANK
78.5%
GED/EQUIVALENCY
0.0/ 100
METRIC RATING
334th/ 347
METRIC RANK
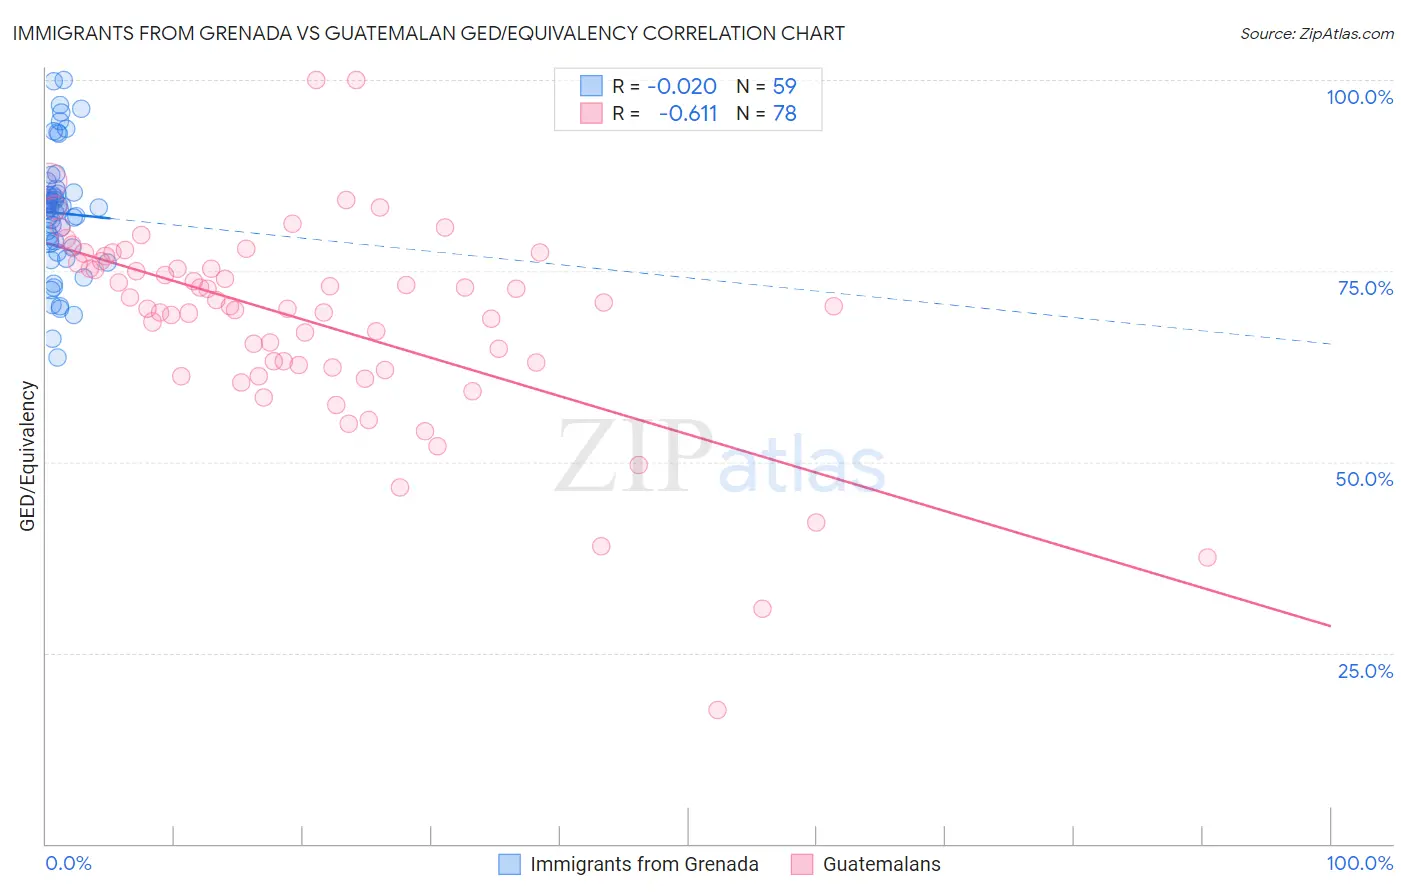
Immigrants from Grenada vs Guatemalan GED/Equivalency Correlation Chart
The statistical analysis conducted on geographies consisting of 67,201,908 people shows no correlation between the proportion of Immigrants from Grenada and percentage of population with at least ged/equivalency education in the United States with a correlation coefficient (R) of -0.020 and weighted average of 81.3%. Similarly, the statistical analysis conducted on geographies consisting of 409,566,541 people shows a significant negative correlation between the proportion of Guatemalans and percentage of population with at least ged/equivalency education in the United States with a correlation coefficient (R) of -0.611 and weighted average of 78.5%, a difference of 3.6%.
GED/Equivalency Correlation Summary
| Measurement | Immigrants from Grenada | Guatemalan |
| Minimum | 63.6% | 17.6% |
| Maximum | 100.0% | 100.0% |
| Range | 36.4% | 82.4% |
| Mean | 82.6% | 68.3% |
| Median | 83.2% | 70.4% |
| Interquartile 25% (IQ1) | 78.1% | 62.3% |
| Interquartile 75% (IQ3) | 85.3% | 76.0% |
| Interquartile Range (IQR) | 7.2% | 13.7% |
| Standard Deviation (Sample) | 8.0% | 13.4% |
| Standard Deviation (Population) | 7.9% | 13.3% |
Similar Demographics by GED/Equivalency
Demographics Similar to Immigrants from Grenada by GED/Equivalency
In terms of ged/equivalency, the demographic groups most similar to Immigrants from Grenada are Guyanese (81.3%, a difference of 0.020%), Immigrants from Dominica (81.1%, a difference of 0.19%), Navajo (81.5%, a difference of 0.21%), Puerto Rican (81.1%, a difference of 0.30%), and Immigrants from Haiti (81.6%, a difference of 0.31%).
| Demographics | Rating | Rank | GED/Equivalency |
| Ute | 0.0 /100 | #298 | Tragic 81.8% |
| Ecuadorians | 0.0 /100 | #299 | Tragic 81.7% |
| Fijians | 0.0 /100 | #300 | Tragic 81.6% |
| Dutch West Indians | 0.0 /100 | #301 | Tragic 81.6% |
| Immigrants | Haiti | 0.0 /100 | #302 | Tragic 81.6% |
| Immigrants | Portugal | 0.0 /100 | #303 | Tragic 81.6% |
| Navajo | 0.0 /100 | #304 | Tragic 81.5% |
| Immigrants | Grenada | 0.0 /100 | #305 | Tragic 81.3% |
| Guyanese | 0.0 /100 | #306 | Tragic 81.3% |
| Immigrants | Dominica | 0.0 /100 | #307 | Tragic 81.1% |
| Puerto Ricans | 0.0 /100 | #308 | Tragic 81.1% |
| Immigrants | Ecuador | 0.0 /100 | #309 | Tragic 81.0% |
| Immigrants | Guyana | 0.0 /100 | #310 | Tragic 81.0% |
| Natives/Alaskans | 0.0 /100 | #311 | Tragic 80.9% |
| Nicaraguans | 0.0 /100 | #312 | Tragic 80.9% |
Demographics Similar to Guatemalans by GED/Equivalency
In terms of ged/equivalency, the demographic groups most similar to Guatemalans are Immigrants from Latin America (78.5%, a difference of 0.020%), Salvadoran (78.6%, a difference of 0.080%), Immigrants from the Azores (78.7%, a difference of 0.20%), Immigrants from Honduras (78.7%, a difference of 0.31%), and Immigrants from Cabo Verde (78.9%, a difference of 0.55%).
| Demographics | Rating | Rank | GED/Equivalency |
| Central Americans | 0.0 /100 | #327 | Tragic 79.2% |
| Hispanics or Latinos | 0.0 /100 | #328 | Tragic 79.1% |
| Dominicans | 0.0 /100 | #329 | Tragic 79.1% |
| Immigrants | Cabo Verde | 0.0 /100 | #330 | Tragic 78.9% |
| Immigrants | Honduras | 0.0 /100 | #331 | Tragic 78.7% |
| Immigrants | Azores | 0.0 /100 | #332 | Tragic 78.7% |
| Salvadorans | 0.0 /100 | #333 | Tragic 78.6% |
| Guatemalans | 0.0 /100 | #334 | Tragic 78.5% |
| Immigrants | Latin America | 0.0 /100 | #335 | Tragic 78.5% |
| Immigrants | Dominican Republic | 0.0 /100 | #336 | Tragic 78.0% |
| Immigrants | Yemen | 0.0 /100 | #337 | Tragic 77.9% |
| Immigrants | Guatemala | 0.0 /100 | #338 | Tragic 77.9% |
| Immigrants | El Salvador | 0.0 /100 | #339 | Tragic 77.6% |
| Tohono O'odham | 0.0 /100 | #340 | Tragic 77.5% |
| Mexicans | 0.0 /100 | #341 | Tragic 77.4% |