Immigrants from Grenada vs Haitian GED/Equivalency
COMPARE
Immigrants from Grenada
Haitian
GED/Equivalency
GED/Equivalency Comparison
Immigrants from Grenada
Haitians
81.3%
GED/EQUIVALENCY
0.0/ 100
METRIC RATING
305th/ 347
METRIC RANK
82.1%
GED/EQUIVALENCY
0.0/ 100
METRIC RATING
290th/ 347
METRIC RANK
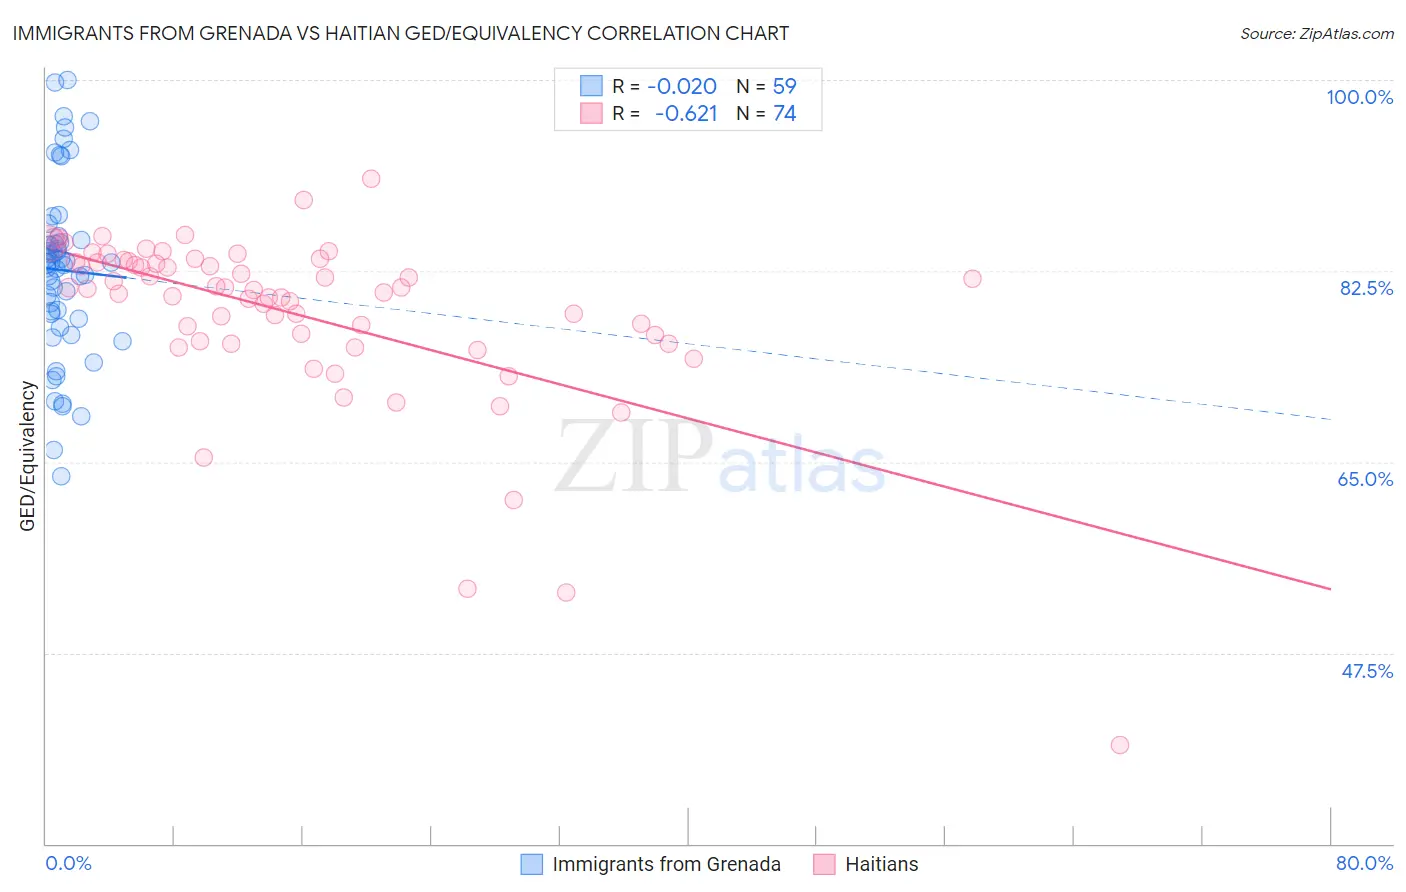
Immigrants from Grenada vs Haitian GED/Equivalency Correlation Chart
The statistical analysis conducted on geographies consisting of 67,201,908 people shows no correlation between the proportion of Immigrants from Grenada and percentage of population with at least ged/equivalency education in the United States with a correlation coefficient (R) of -0.020 and weighted average of 81.3%. Similarly, the statistical analysis conducted on geographies consisting of 288,018,742 people shows a significant negative correlation between the proportion of Haitians and percentage of population with at least ged/equivalency education in the United States with a correlation coefficient (R) of -0.621 and weighted average of 82.1%, a difference of 0.93%.
GED/Equivalency Correlation Summary
| Measurement | Immigrants from Grenada | Haitian |
| Minimum | 63.6% | 39.0% |
| Maximum | 100.0% | 90.9% |
| Range | 36.4% | 51.9% |
| Mean | 82.6% | 78.6% |
| Median | 83.2% | 80.8% |
| Interquartile 25% (IQ1) | 78.1% | 76.1% |
| Interquartile 75% (IQ3) | 85.3% | 83.3% |
| Interquartile Range (IQR) | 7.2% | 7.2% |
| Standard Deviation (Sample) | 8.0% | 8.2% |
| Standard Deviation (Population) | 7.9% | 8.1% |
Demographics Similar to Immigrants from Grenada and Haitians by GED/Equivalency
In terms of ged/equivalency, the demographic groups most similar to Immigrants from Grenada are Guyanese (81.3%, a difference of 0.020%), Immigrants from Dominica (81.1%, a difference of 0.19%), Navajo (81.5%, a difference of 0.21%), Immigrants from Haiti (81.6%, a difference of 0.31%), and Immigrants from Portugal (81.6%, a difference of 0.31%). Similarly, the demographic groups most similar to Haitians are Cuban (82.0%, a difference of 0.020%), Paiute (82.0%, a difference of 0.060%), British West Indian (82.0%, a difference of 0.070%), Immigrants from St. Vincent and the Grenadines (82.0%, a difference of 0.090%), and Nepalese (81.9%, a difference of 0.15%).
| Demographics | Rating | Rank | GED/Equivalency |
| Japanese | 0.0 /100 | #287 | Tragic 82.4% |
| Pueblo | 0.0 /100 | #288 | Tragic 82.3% |
| Immigrants | Cambodia | 0.0 /100 | #289 | Tragic 82.2% |
| Haitians | 0.0 /100 | #290 | Tragic 82.1% |
| Cubans | 0.0 /100 | #291 | Tragic 82.0% |
| Paiute | 0.0 /100 | #292 | Tragic 82.0% |
| British West Indians | 0.0 /100 | #293 | Tragic 82.0% |
| Immigrants | St. Vincent and the Grenadines | 0.0 /100 | #294 | Tragic 82.0% |
| Nepalese | 0.0 /100 | #295 | Tragic 81.9% |
| Vietnamese | 0.0 /100 | #296 | Tragic 81.9% |
| Immigrants | Bangladesh | 0.0 /100 | #297 | Tragic 81.9% |
| Ute | 0.0 /100 | #298 | Tragic 81.8% |
| Ecuadorians | 0.0 /100 | #299 | Tragic 81.7% |
| Fijians | 0.0 /100 | #300 | Tragic 81.6% |
| Dutch West Indians | 0.0 /100 | #301 | Tragic 81.6% |
| Immigrants | Haiti | 0.0 /100 | #302 | Tragic 81.6% |
| Immigrants | Portugal | 0.0 /100 | #303 | Tragic 81.6% |
| Navajo | 0.0 /100 | #304 | Tragic 81.5% |
| Immigrants | Grenada | 0.0 /100 | #305 | Tragic 81.3% |
| Guyanese | 0.0 /100 | #306 | Tragic 81.3% |
| Immigrants | Dominica | 0.0 /100 | #307 | Tragic 81.1% |