Immigrants from Grenada vs Uruguayan GED/Equivalency
COMPARE
Immigrants from Grenada
Uruguayan
GED/Equivalency
GED/Equivalency Comparison
Immigrants from Grenada
Uruguayans
81.3%
GED/EQUIVALENCY
0.0/ 100
METRIC RATING
305th/ 347
METRIC RANK
85.0%
GED/EQUIVALENCY
16.0/ 100
METRIC RATING
200th/ 347
METRIC RANK
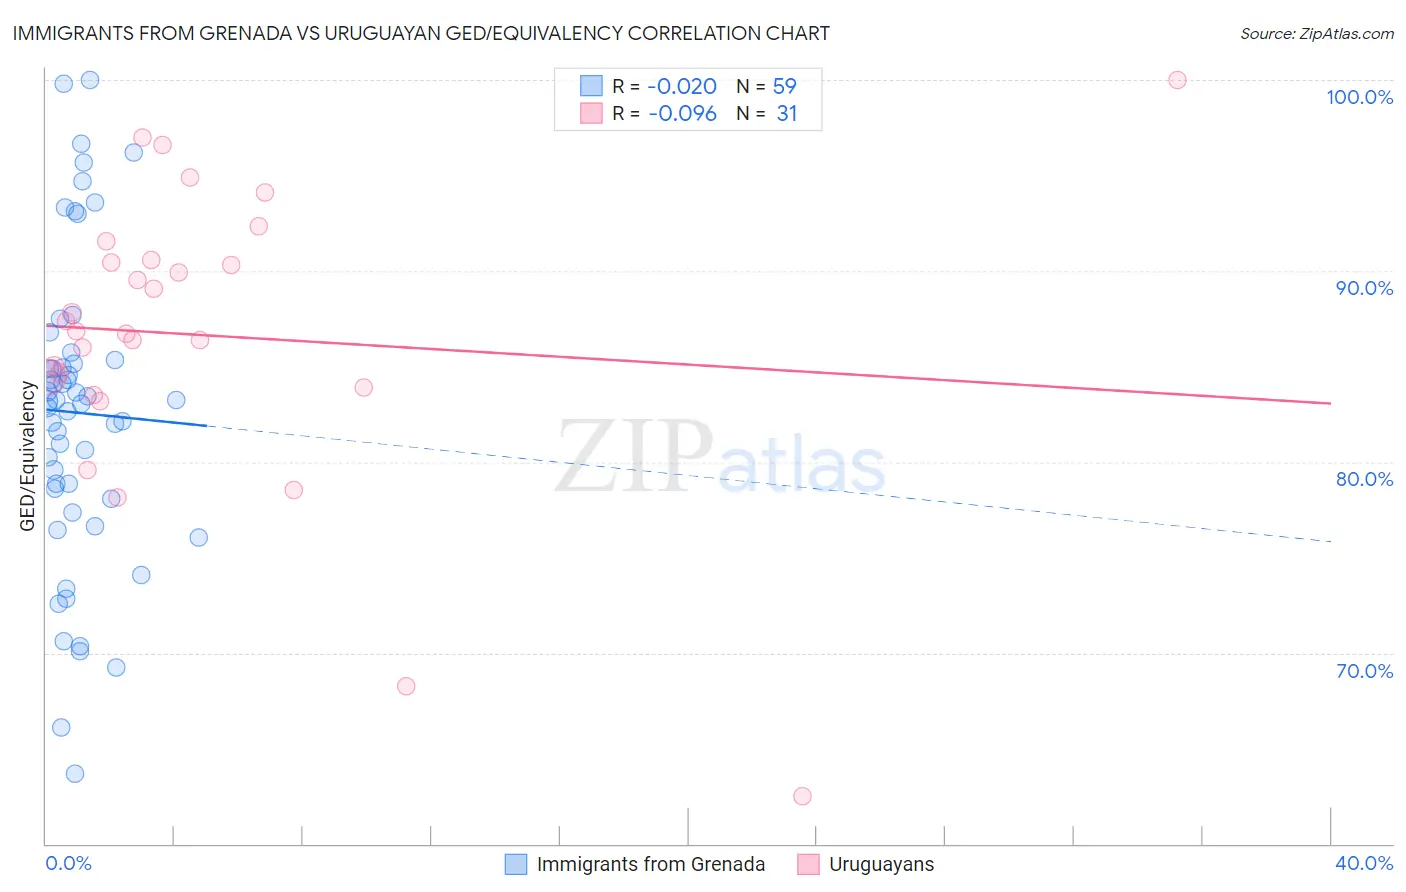
Immigrants from Grenada vs Uruguayan GED/Equivalency Correlation Chart
The statistical analysis conducted on geographies consisting of 67,201,908 people shows no correlation between the proportion of Immigrants from Grenada and percentage of population with at least ged/equivalency education in the United States with a correlation coefficient (R) of -0.020 and weighted average of 81.3%. Similarly, the statistical analysis conducted on geographies consisting of 144,782,615 people shows a slight negative correlation between the proportion of Uruguayans and percentage of population with at least ged/equivalency education in the United States with a correlation coefficient (R) of -0.096 and weighted average of 85.0%, a difference of 4.6%.
GED/Equivalency Correlation Summary
| Measurement | Immigrants from Grenada | Uruguayan |
| Minimum | 63.6% | 62.5% |
| Maximum | 100.0% | 100.0% |
| Range | 36.4% | 37.5% |
| Mean | 82.6% | 86.6% |
| Median | 83.2% | 86.9% |
| Interquartile 25% (IQ1) | 78.1% | 83.9% |
| Interquartile 75% (IQ3) | 85.3% | 90.5% |
| Interquartile Range (IQR) | 7.2% | 6.7% |
| Standard Deviation (Sample) | 8.0% | 7.7% |
| Standard Deviation (Population) | 7.9% | 7.6% |
Similar Demographics by GED/Equivalency
Demographics Similar to Immigrants from Grenada by GED/Equivalency
In terms of ged/equivalency, the demographic groups most similar to Immigrants from Grenada are Guyanese (81.3%, a difference of 0.020%), Immigrants from Dominica (81.1%, a difference of 0.19%), Navajo (81.5%, a difference of 0.21%), Puerto Rican (81.1%, a difference of 0.30%), and Immigrants from Haiti (81.6%, a difference of 0.31%).
| Demographics | Rating | Rank | GED/Equivalency |
| Ute | 0.0 /100 | #298 | Tragic 81.8% |
| Ecuadorians | 0.0 /100 | #299 | Tragic 81.7% |
| Fijians | 0.0 /100 | #300 | Tragic 81.6% |
| Dutch West Indians | 0.0 /100 | #301 | Tragic 81.6% |
| Immigrants | Haiti | 0.0 /100 | #302 | Tragic 81.6% |
| Immigrants | Portugal | 0.0 /100 | #303 | Tragic 81.6% |
| Navajo | 0.0 /100 | #304 | Tragic 81.5% |
| Immigrants | Grenada | 0.0 /100 | #305 | Tragic 81.3% |
| Guyanese | 0.0 /100 | #306 | Tragic 81.3% |
| Immigrants | Dominica | 0.0 /100 | #307 | Tragic 81.1% |
| Puerto Ricans | 0.0 /100 | #308 | Tragic 81.1% |
| Immigrants | Ecuador | 0.0 /100 | #309 | Tragic 81.0% |
| Immigrants | Guyana | 0.0 /100 | #310 | Tragic 81.0% |
| Natives/Alaskans | 0.0 /100 | #311 | Tragic 80.9% |
| Nicaraguans | 0.0 /100 | #312 | Tragic 80.9% |
Demographics Similar to Uruguayans by GED/Equivalency
In terms of ged/equivalency, the demographic groups most similar to Uruguayans are Portuguese (85.0%, a difference of 0.0%), Somali (85.0%, a difference of 0.010%), Cree (85.0%, a difference of 0.010%), Panamanian (85.0%, a difference of 0.030%), and Hawaiian (85.0%, a difference of 0.030%).
| Demographics | Rating | Rank | GED/Equivalency |
| Delaware | 22.2 /100 | #193 | Fair 85.2% |
| Puget Sound Salish | 20.8 /100 | #194 | Fair 85.2% |
| Chippewa | 20.8 /100 | #195 | Fair 85.2% |
| Tongans | 20.7 /100 | #196 | Fair 85.2% |
| Costa Ricans | 20.4 /100 | #197 | Fair 85.2% |
| Immigrants | Africa | 17.5 /100 | #198 | Poor 85.1% |
| Somalis | 16.4 /100 | #199 | Poor 85.0% |
| Uruguayans | 16.0 /100 | #200 | Poor 85.0% |
| Portuguese | 15.9 /100 | #201 | Poor 85.0% |
| Cree | 15.9 /100 | #202 | Poor 85.0% |
| Panamanians | 15.3 /100 | #203 | Poor 85.0% |
| Hawaiians | 15.2 /100 | #204 | Poor 85.0% |
| Liberians | 14.6 /100 | #205 | Poor 85.0% |
| Samoans | 13.7 /100 | #206 | Poor 84.9% |
| Hmong | 13.1 /100 | #207 | Poor 84.9% |