Immigrants from Grenada vs Mongolian GED/Equivalency
COMPARE
Immigrants from Grenada
Mongolian
GED/Equivalency
GED/Equivalency Comparison
Immigrants from Grenada
Mongolians
81.3%
GED/EQUIVALENCY
0.0/ 100
METRIC RATING
305th/ 347
METRIC RANK
87.0%
GED/EQUIVALENCY
94.6/ 100
METRIC RATING
115th/ 347
METRIC RANK
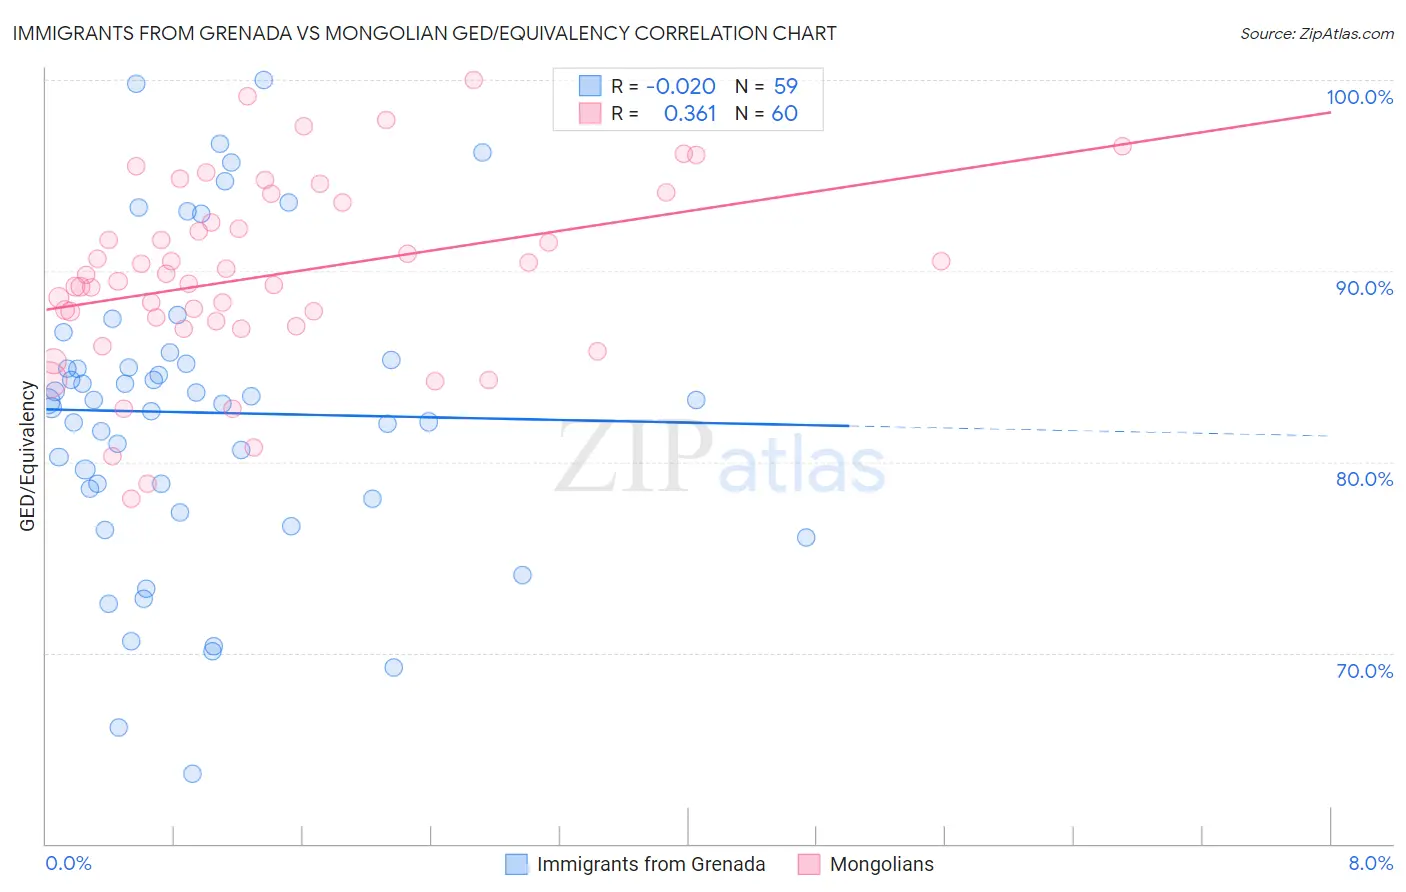
Immigrants from Grenada vs Mongolian GED/Equivalency Correlation Chart
The statistical analysis conducted on geographies consisting of 67,201,908 people shows no correlation between the proportion of Immigrants from Grenada and percentage of population with at least ged/equivalency education in the United States with a correlation coefficient (R) of -0.020 and weighted average of 81.3%. Similarly, the statistical analysis conducted on geographies consisting of 140,361,663 people shows a mild positive correlation between the proportion of Mongolians and percentage of population with at least ged/equivalency education in the United States with a correlation coefficient (R) of 0.361 and weighted average of 87.0%, a difference of 7.0%.
GED/Equivalency Correlation Summary
| Measurement | Immigrants from Grenada | Mongolian |
| Minimum | 63.6% | 78.1% |
| Maximum | 100.0% | 100.0% |
| Range | 36.4% | 21.9% |
| Mean | 82.6% | 89.8% |
| Median | 83.2% | 89.6% |
| Interquartile 25% (IQ1) | 78.1% | 87.2% |
| Interquartile 75% (IQ3) | 85.3% | 93.1% |
| Interquartile Range (IQR) | 7.2% | 5.8% |
| Standard Deviation (Sample) | 8.0% | 4.8% |
| Standard Deviation (Population) | 7.9% | 4.8% |
Similar Demographics by GED/Equivalency
Demographics Similar to Immigrants from Grenada by GED/Equivalency
In terms of ged/equivalency, the demographic groups most similar to Immigrants from Grenada are Guyanese (81.3%, a difference of 0.020%), Immigrants from Dominica (81.1%, a difference of 0.19%), Navajo (81.5%, a difference of 0.21%), Puerto Rican (81.1%, a difference of 0.30%), and Immigrants from Haiti (81.6%, a difference of 0.31%).
| Demographics | Rating | Rank | GED/Equivalency |
| Ute | 0.0 /100 | #298 | Tragic 81.8% |
| Ecuadorians | 0.0 /100 | #299 | Tragic 81.7% |
| Fijians | 0.0 /100 | #300 | Tragic 81.6% |
| Dutch West Indians | 0.0 /100 | #301 | Tragic 81.6% |
| Immigrants | Haiti | 0.0 /100 | #302 | Tragic 81.6% |
| Immigrants | Portugal | 0.0 /100 | #303 | Tragic 81.6% |
| Navajo | 0.0 /100 | #304 | Tragic 81.5% |
| Immigrants | Grenada | 0.0 /100 | #305 | Tragic 81.3% |
| Guyanese | 0.0 /100 | #306 | Tragic 81.3% |
| Immigrants | Dominica | 0.0 /100 | #307 | Tragic 81.1% |
| Puerto Ricans | 0.0 /100 | #308 | Tragic 81.1% |
| Immigrants | Ecuador | 0.0 /100 | #309 | Tragic 81.0% |
| Immigrants | Guyana | 0.0 /100 | #310 | Tragic 81.0% |
| Natives/Alaskans | 0.0 /100 | #311 | Tragic 80.9% |
| Nicaraguans | 0.0 /100 | #312 | Tragic 80.9% |
Demographics Similar to Mongolians by GED/Equivalency
In terms of ged/equivalency, the demographic groups most similar to Mongolians are Immigrants from Kazakhstan (87.0%, a difference of 0.010%), Swiss (87.0%, a difference of 0.010%), Tlingit-Haida (87.0%, a difference of 0.020%), Assyrian/Chaldean/Syriac (87.0%, a difference of 0.020%), and French (87.1%, a difference of 0.060%).
| Demographics | Rating | Rank | GED/Equivalency |
| Canadians | 95.6 /100 | #108 | Exceptional 87.1% |
| Immigrants | Eastern Europe | 95.5 /100 | #109 | Exceptional 87.1% |
| Egyptians | 95.3 /100 | #110 | Exceptional 87.1% |
| French | 95.2 /100 | #111 | Exceptional 87.1% |
| Tlingit-Haida | 94.8 /100 | #112 | Exceptional 87.0% |
| Assyrians/Chaldeans/Syriacs | 94.8 /100 | #113 | Exceptional 87.0% |
| Immigrants | Kazakhstan | 94.7 /100 | #114 | Exceptional 87.0% |
| Mongolians | 94.6 /100 | #115 | Exceptional 87.0% |
| Swiss | 94.5 /100 | #116 | Exceptional 87.0% |
| Immigrants | Hong Kong | 93.8 /100 | #117 | Exceptional 86.9% |
| French Canadians | 93.2 /100 | #118 | Exceptional 86.9% |
| Immigrants | China | 93.2 /100 | #119 | Exceptional 86.9% |
| Scotch-Irish | 91.6 /100 | #120 | Exceptional 86.8% |
| Immigrants | Lebanon | 90.9 /100 | #121 | Exceptional 86.8% |
| Immigrants | Jordan | 90.8 /100 | #122 | Exceptional 86.8% |