Dutch West Indian vs Immigrants from Netherlands GED/Equivalency
COMPARE
Dutch West Indian
Immigrants from Netherlands
GED/Equivalency
GED/Equivalency Comparison
Dutch West Indians
Immigrants from Netherlands
81.6%
GED/EQUIVALENCY
0.0/ 100
METRIC RATING
301st/ 347
METRIC RANK
88.0%
GED/EQUIVALENCY
99.4/ 100
METRIC RATING
51st/ 347
METRIC RANK
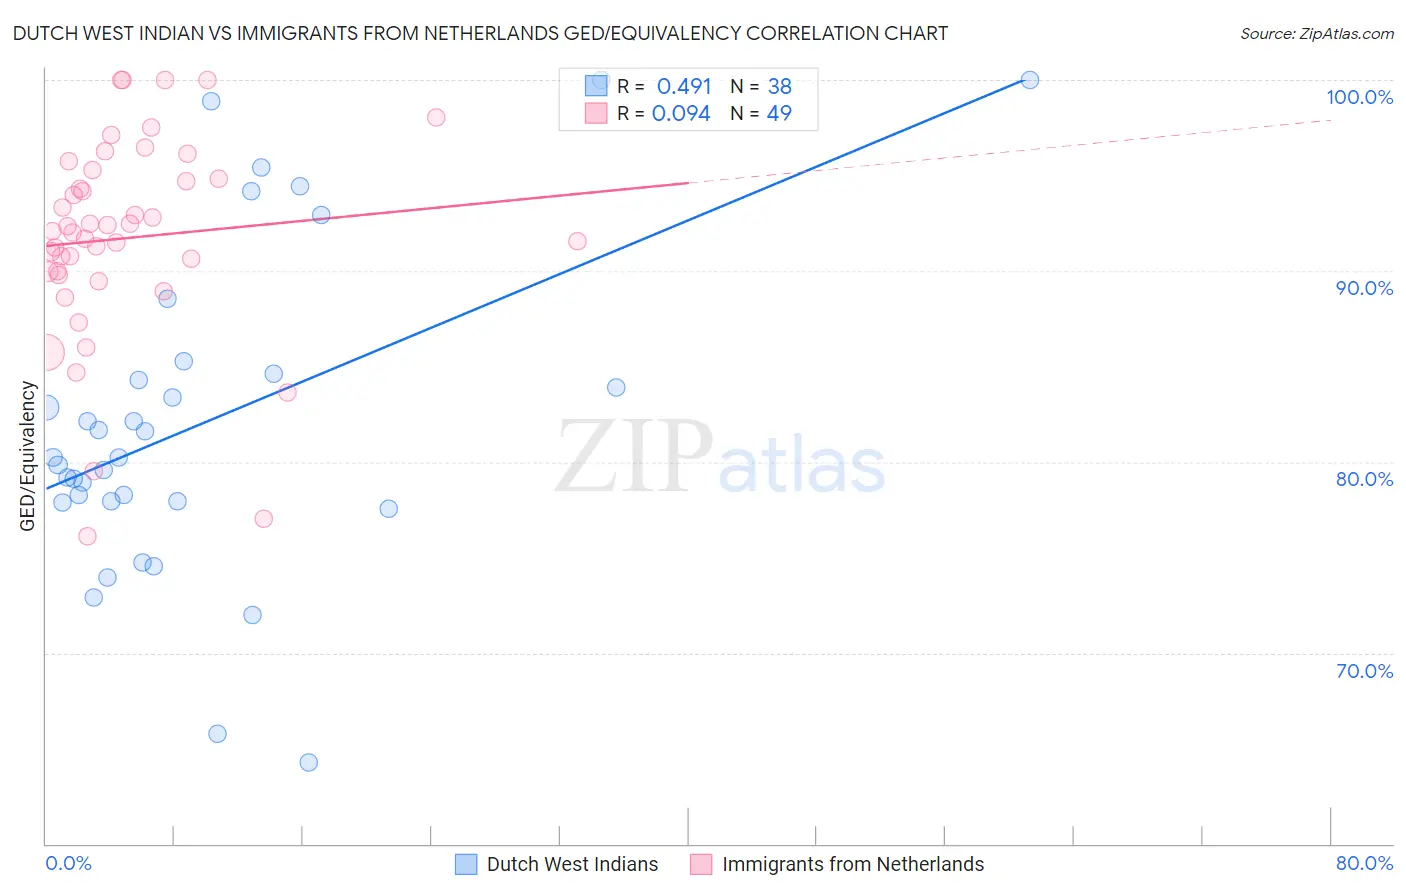
Dutch West Indian vs Immigrants from Netherlands GED/Equivalency Correlation Chart
The statistical analysis conducted on geographies consisting of 85,776,098 people shows a moderate positive correlation between the proportion of Dutch West Indians and percentage of population with at least ged/equivalency education in the United States with a correlation coefficient (R) of 0.491 and weighted average of 81.6%. Similarly, the statistical analysis conducted on geographies consisting of 237,874,463 people shows a slight positive correlation between the proportion of Immigrants from Netherlands and percentage of population with at least ged/equivalency education in the United States with a correlation coefficient (R) of 0.094 and weighted average of 88.0%, a difference of 7.9%.
GED/Equivalency Correlation Summary
| Measurement | Dutch West Indian | Immigrants from Netherlands |
| Minimum | 64.3% | 76.1% |
| Maximum | 100.0% | 100.0% |
| Range | 35.7% | 23.9% |
| Mean | 82.1% | 91.7% |
| Median | 80.2% | 92.1% |
| Interquartile 25% (IQ1) | 78.0% | 89.9% |
| Interquartile 75% (IQ3) | 84.6% | 95.1% |
| Interquartile Range (IQR) | 6.7% | 5.2% |
| Standard Deviation (Sample) | 8.5% | 5.3% |
| Standard Deviation (Population) | 8.4% | 5.3% |
Similar Demographics by GED/Equivalency
Demographics Similar to Dutch West Indians by GED/Equivalency
In terms of ged/equivalency, the demographic groups most similar to Dutch West Indians are Immigrants from Haiti (81.6%, a difference of 0.040%), Immigrants from Portugal (81.6%, a difference of 0.040%), Fijian (81.6%, a difference of 0.060%), Ecuadorian (81.7%, a difference of 0.13%), and Navajo (81.5%, a difference of 0.14%).
| Demographics | Rating | Rank | GED/Equivalency |
| Immigrants | St. Vincent and the Grenadines | 0.0 /100 | #294 | Tragic 82.0% |
| Nepalese | 0.0 /100 | #295 | Tragic 81.9% |
| Vietnamese | 0.0 /100 | #296 | Tragic 81.9% |
| Immigrants | Bangladesh | 0.0 /100 | #297 | Tragic 81.9% |
| Ute | 0.0 /100 | #298 | Tragic 81.8% |
| Ecuadorians | 0.0 /100 | #299 | Tragic 81.7% |
| Fijians | 0.0 /100 | #300 | Tragic 81.6% |
| Dutch West Indians | 0.0 /100 | #301 | Tragic 81.6% |
| Immigrants | Haiti | 0.0 /100 | #302 | Tragic 81.6% |
| Immigrants | Portugal | 0.0 /100 | #303 | Tragic 81.6% |
| Navajo | 0.0 /100 | #304 | Tragic 81.5% |
| Immigrants | Grenada | 0.0 /100 | #305 | Tragic 81.3% |
| Guyanese | 0.0 /100 | #306 | Tragic 81.3% |
| Immigrants | Dominica | 0.0 /100 | #307 | Tragic 81.1% |
| Puerto Ricans | 0.0 /100 | #308 | Tragic 81.1% |
Demographics Similar to Immigrants from Netherlands by GED/Equivalency
In terms of ged/equivalency, the demographic groups most similar to Immigrants from Netherlands are Zimbabwean (88.0%, a difference of 0.0%), Immigrants from South Africa (88.0%, a difference of 0.0%), Soviet Union (88.0%, a difference of 0.010%), New Zealander (88.0%, a difference of 0.020%), and Immigrants from Denmark (88.0%, a difference of 0.030%).
| Demographics | Rating | Rank | GED/Equivalency |
| Macedonians | 99.5 /100 | #44 | Exceptional 88.1% |
| Czechs | 99.5 /100 | #45 | Exceptional 88.1% |
| Immigrants | Switzerland | 99.5 /100 | #46 | Exceptional 88.1% |
| Immigrants | Latvia | 99.5 /100 | #47 | Exceptional 88.1% |
| Greeks | 99.5 /100 | #48 | Exceptional 88.1% |
| Australians | 99.5 /100 | #49 | Exceptional 88.1% |
| Immigrants | Korea | 99.5 /100 | #50 | Exceptional 88.1% |
| Immigrants | Netherlands | 99.4 /100 | #51 | Exceptional 88.0% |
| Zimbabweans | 99.4 /100 | #52 | Exceptional 88.0% |
| Immigrants | South Africa | 99.4 /100 | #53 | Exceptional 88.0% |
| Soviet Union | 99.4 /100 | #54 | Exceptional 88.0% |
| New Zealanders | 99.4 /100 | #55 | Exceptional 88.0% |
| Immigrants | Denmark | 99.4 /100 | #56 | Exceptional 88.0% |
| Immigrants | Czechoslovakia | 99.3 /100 | #57 | Exceptional 87.9% |
| Northern Europeans | 99.3 /100 | #58 | Exceptional 87.9% |