Egyptian vs Immigrants from Netherlands GED/Equivalency
COMPARE
Egyptian
Immigrants from Netherlands
GED/Equivalency
GED/Equivalency Comparison
Egyptians
Immigrants from Netherlands
87.1%
GED/EQUIVALENCY
95.3/ 100
METRIC RATING
110th/ 347
METRIC RANK
88.0%
GED/EQUIVALENCY
99.4/ 100
METRIC RATING
51st/ 347
METRIC RANK
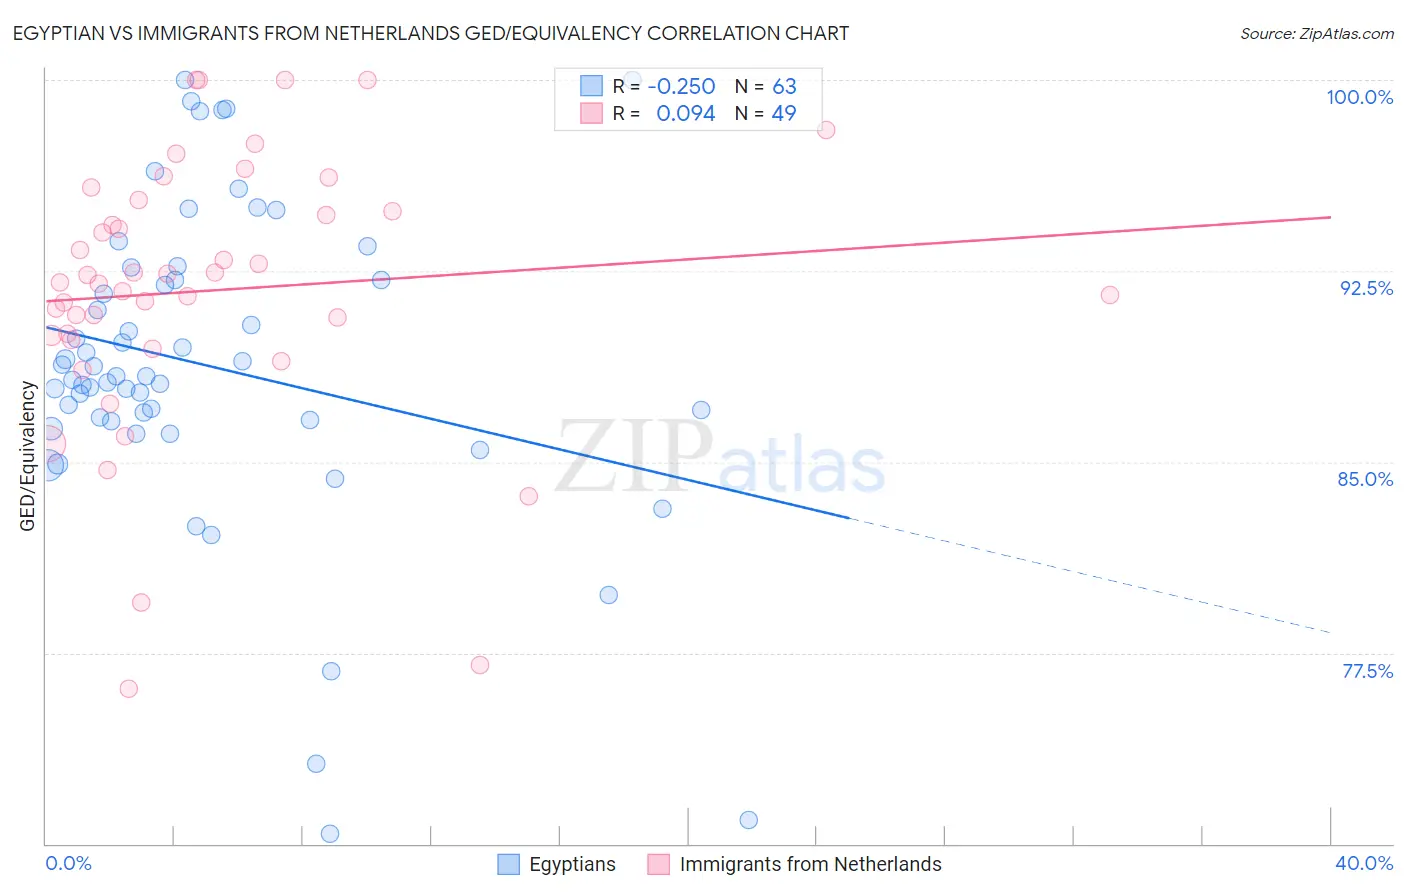
Egyptian vs Immigrants from Netherlands GED/Equivalency Correlation Chart
The statistical analysis conducted on geographies consisting of 276,927,519 people shows a weak negative correlation between the proportion of Egyptians and percentage of population with at least ged/equivalency education in the United States with a correlation coefficient (R) of -0.250 and weighted average of 87.1%. Similarly, the statistical analysis conducted on geographies consisting of 237,874,463 people shows a slight positive correlation between the proportion of Immigrants from Netherlands and percentage of population with at least ged/equivalency education in the United States with a correlation coefficient (R) of 0.094 and weighted average of 88.0%, a difference of 1.1%.
GED/Equivalency Correlation Summary
| Measurement | Egyptian | Immigrants from Netherlands |
| Minimum | 70.4% | 76.1% |
| Maximum | 100.0% | 100.0% |
| Range | 29.6% | 23.9% |
| Mean | 88.8% | 91.7% |
| Median | 88.3% | 92.1% |
| Interquartile 25% (IQ1) | 86.6% | 89.9% |
| Interquartile 75% (IQ3) | 92.2% | 95.1% |
| Interquartile Range (IQR) | 5.5% | 5.2% |
| Standard Deviation (Sample) | 6.2% | 5.3% |
| Standard Deviation (Population) | 6.1% | 5.3% |
Similar Demographics by GED/Equivalency
Demographics Similar to Egyptians by GED/Equivalency
In terms of ged/equivalency, the demographic groups most similar to Egyptians are French (87.1%, a difference of 0.0%), Immigrants from Eastern Europe (87.1%, a difference of 0.030%), Canadian (87.1%, a difference of 0.040%), Icelander (87.1%, a difference of 0.050%), and Tlingit-Haida (87.0%, a difference of 0.050%).
| Demographics | Rating | Rank | GED/Equivalency |
| Jordanians | 96.1 /100 | #103 | Exceptional 87.2% |
| Immigrants | Hungary | 96.0 /100 | #104 | Exceptional 87.2% |
| Indians (Asian) | 95.9 /100 | #105 | Exceptional 87.1% |
| Immigrants | Zimbabwe | 95.8 /100 | #106 | Exceptional 87.1% |
| Icelanders | 95.7 /100 | #107 | Exceptional 87.1% |
| Canadians | 95.6 /100 | #108 | Exceptional 87.1% |
| Immigrants | Eastern Europe | 95.5 /100 | #109 | Exceptional 87.1% |
| Egyptians | 95.3 /100 | #110 | Exceptional 87.1% |
| French | 95.2 /100 | #111 | Exceptional 87.1% |
| Tlingit-Haida | 94.8 /100 | #112 | Exceptional 87.0% |
| Assyrians/Chaldeans/Syriacs | 94.8 /100 | #113 | Exceptional 87.0% |
| Immigrants | Kazakhstan | 94.7 /100 | #114 | Exceptional 87.0% |
| Mongolians | 94.6 /100 | #115 | Exceptional 87.0% |
| Swiss | 94.5 /100 | #116 | Exceptional 87.0% |
| Immigrants | Hong Kong | 93.8 /100 | #117 | Exceptional 86.9% |
Demographics Similar to Immigrants from Netherlands by GED/Equivalency
In terms of ged/equivalency, the demographic groups most similar to Immigrants from Netherlands are Zimbabwean (88.0%, a difference of 0.0%), Immigrants from South Africa (88.0%, a difference of 0.0%), Soviet Union (88.0%, a difference of 0.010%), New Zealander (88.0%, a difference of 0.020%), and Immigrants from Denmark (88.0%, a difference of 0.030%).
| Demographics | Rating | Rank | GED/Equivalency |
| Macedonians | 99.5 /100 | #44 | Exceptional 88.1% |
| Czechs | 99.5 /100 | #45 | Exceptional 88.1% |
| Immigrants | Switzerland | 99.5 /100 | #46 | Exceptional 88.1% |
| Immigrants | Latvia | 99.5 /100 | #47 | Exceptional 88.1% |
| Greeks | 99.5 /100 | #48 | Exceptional 88.1% |
| Australians | 99.5 /100 | #49 | Exceptional 88.1% |
| Immigrants | Korea | 99.5 /100 | #50 | Exceptional 88.1% |
| Immigrants | Netherlands | 99.4 /100 | #51 | Exceptional 88.0% |
| Zimbabweans | 99.4 /100 | #52 | Exceptional 88.0% |
| Immigrants | South Africa | 99.4 /100 | #53 | Exceptional 88.0% |
| Soviet Union | 99.4 /100 | #54 | Exceptional 88.0% |
| New Zealanders | 99.4 /100 | #55 | Exceptional 88.0% |
| Immigrants | Denmark | 99.4 /100 | #56 | Exceptional 88.0% |
| Immigrants | Czechoslovakia | 99.3 /100 | #57 | Exceptional 87.9% |
| Northern Europeans | 99.3 /100 | #58 | Exceptional 87.9% |