Immigrants from Burma/Myanmar vs Immigrants from Zaire High School Diploma
COMPARE
Immigrants from Burma/Myanmar
Immigrants from Zaire
High School Diploma
High School Diploma Comparison
Immigrants from Burma/Myanmar
Immigrants from Zaire
86.7%
HIGH SCHOOL DIPLOMA
0.1/ 100
METRIC RATING
276th/ 347
METRIC RANK
88.3%
HIGH SCHOOL DIPLOMA
7.6/ 100
METRIC RATING
223rd/ 347
METRIC RANK
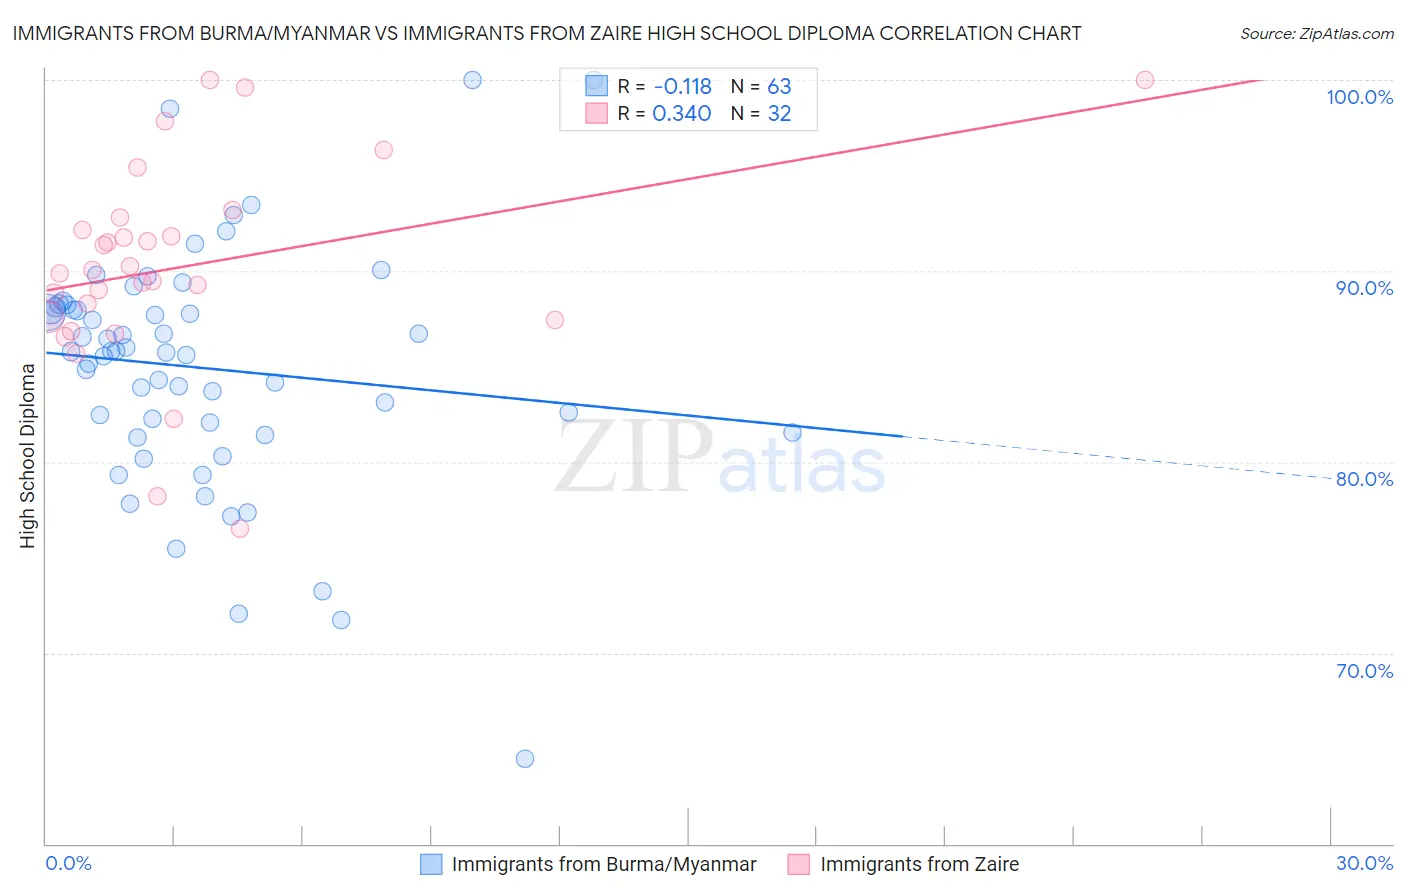
Immigrants from Burma/Myanmar vs Immigrants from Zaire High School Diploma Correlation Chart
The statistical analysis conducted on geographies consisting of 172,345,696 people shows a poor negative correlation between the proportion of Immigrants from Burma/Myanmar and percentage of population with at least high school diploma education in the United States with a correlation coefficient (R) of -0.118 and weighted average of 86.7%. Similarly, the statistical analysis conducted on geographies consisting of 107,255,805 people shows a mild positive correlation between the proportion of Immigrants from Zaire and percentage of population with at least high school diploma education in the United States with a correlation coefficient (R) of 0.340 and weighted average of 88.3%, a difference of 1.9%.
High School Diploma Correlation Summary
| Measurement | Immigrants from Burma/Myanmar | Immigrants from Zaire |
| Minimum | 64.5% | 76.5% |
| Maximum | 100.0% | 100.0% |
| Range | 35.5% | 23.5% |
| Mean | 84.9% | 90.2% |
| Median | 85.8% | 90.0% |
| Interquartile 25% (IQ1) | 81.5% | 87.5% |
| Interquartile 75% (IQ3) | 88.1% | 92.5% |
| Interquartile Range (IQR) | 6.6% | 5.0% |
| Standard Deviation (Sample) | 6.3% | 5.4% |
| Standard Deviation (Population) | 6.3% | 5.3% |
Similar Demographics by High School Diploma
Demographics Similar to Immigrants from Burma/Myanmar by High School Diploma
In terms of high school diploma, the demographic groups most similar to Immigrants from Burma/Myanmar are Barbadian (86.7%, a difference of 0.010%), Immigrants from Trinidad and Tobago (86.8%, a difference of 0.070%), Hopi (86.6%, a difference of 0.11%), Immigrants from Laos (86.6%, a difference of 0.16%), and Pueblo (86.5%, a difference of 0.18%).
| Demographics | Rating | Rank | High School Diploma |
| Sri Lankans | 0.2 /100 | #269 | Tragic 87.0% |
| Malaysians | 0.2 /100 | #270 | Tragic 87.0% |
| West Indians | 0.1 /100 | #271 | Tragic 86.9% |
| Trinidadians and Tobagonians | 0.1 /100 | #272 | Tragic 86.9% |
| Immigrants | Jamaica | 0.1 /100 | #273 | Tragic 86.9% |
| Bangladeshis | 0.1 /100 | #274 | Tragic 86.9% |
| Immigrants | Trinidad and Tobago | 0.1 /100 | #275 | Tragic 86.8% |
| Immigrants | Burma/Myanmar | 0.1 /100 | #276 | Tragic 86.7% |
| Barbadians | 0.1 /100 | #277 | Tragic 86.7% |
| Hopi | 0.1 /100 | #278 | Tragic 86.6% |
| Immigrants | Laos | 0.0 /100 | #279 | Tragic 86.6% |
| Pueblo | 0.0 /100 | #280 | Tragic 86.5% |
| Indonesians | 0.0 /100 | #281 | Tragic 86.5% |
| Dutch West Indians | 0.0 /100 | #282 | Tragic 86.5% |
| Immigrants | Barbados | 0.0 /100 | #283 | Tragic 86.4% |
Demographics Similar to Immigrants from Zaire by High School Diploma
In terms of high school diploma, the demographic groups most similar to Immigrants from Zaire are Colville (88.3%, a difference of 0.010%), Shoshone (88.3%, a difference of 0.040%), Creek (88.3%, a difference of 0.040%), Immigrants from Afghanistan (88.3%, a difference of 0.050%), and Tongan (88.4%, a difference of 0.090%).
| Demographics | Rating | Rank | High School Diploma |
| Chickasaw | 10.7 /100 | #216 | Poor 88.4% |
| Immigrants | Africa | 10.6 /100 | #217 | Poor 88.4% |
| Immigrants | Bolivia | 10.3 /100 | #218 | Poor 88.4% |
| Costa Ricans | 9.6 /100 | #219 | Tragic 88.4% |
| Tongans | 9.5 /100 | #220 | Tragic 88.4% |
| Immigrants | Afghanistan | 8.6 /100 | #221 | Tragic 88.3% |
| Colville | 7.8 /100 | #222 | Tragic 88.3% |
| Immigrants | Zaire | 7.6 /100 | #223 | Tragic 88.3% |
| Shoshone | 7.0 /100 | #224 | Tragic 88.3% |
| Creek | 6.9 /100 | #225 | Tragic 88.3% |
| Uruguayans | 5.6 /100 | #226 | Tragic 88.2% |
| Immigrants | Liberia | 5.5 /100 | #227 | Tragic 88.2% |
| Kiowa | 5.3 /100 | #228 | Tragic 88.2% |
| Nigerians | 5.2 /100 | #229 | Tragic 88.2% |
| Blackfeet | 4.2 /100 | #230 | Tragic 88.1% |