Bahamian vs Immigrants from Zaire High School Diploma
COMPARE
Bahamian
Immigrants from Zaire
High School Diploma
High School Diploma Comparison
Bahamians
Immigrants from Zaire
87.5%
HIGH SCHOOL DIPLOMA
0.7/ 100
METRIC RATING
257th/ 347
METRIC RANK
88.3%
HIGH SCHOOL DIPLOMA
7.6/ 100
METRIC RATING
223rd/ 347
METRIC RANK
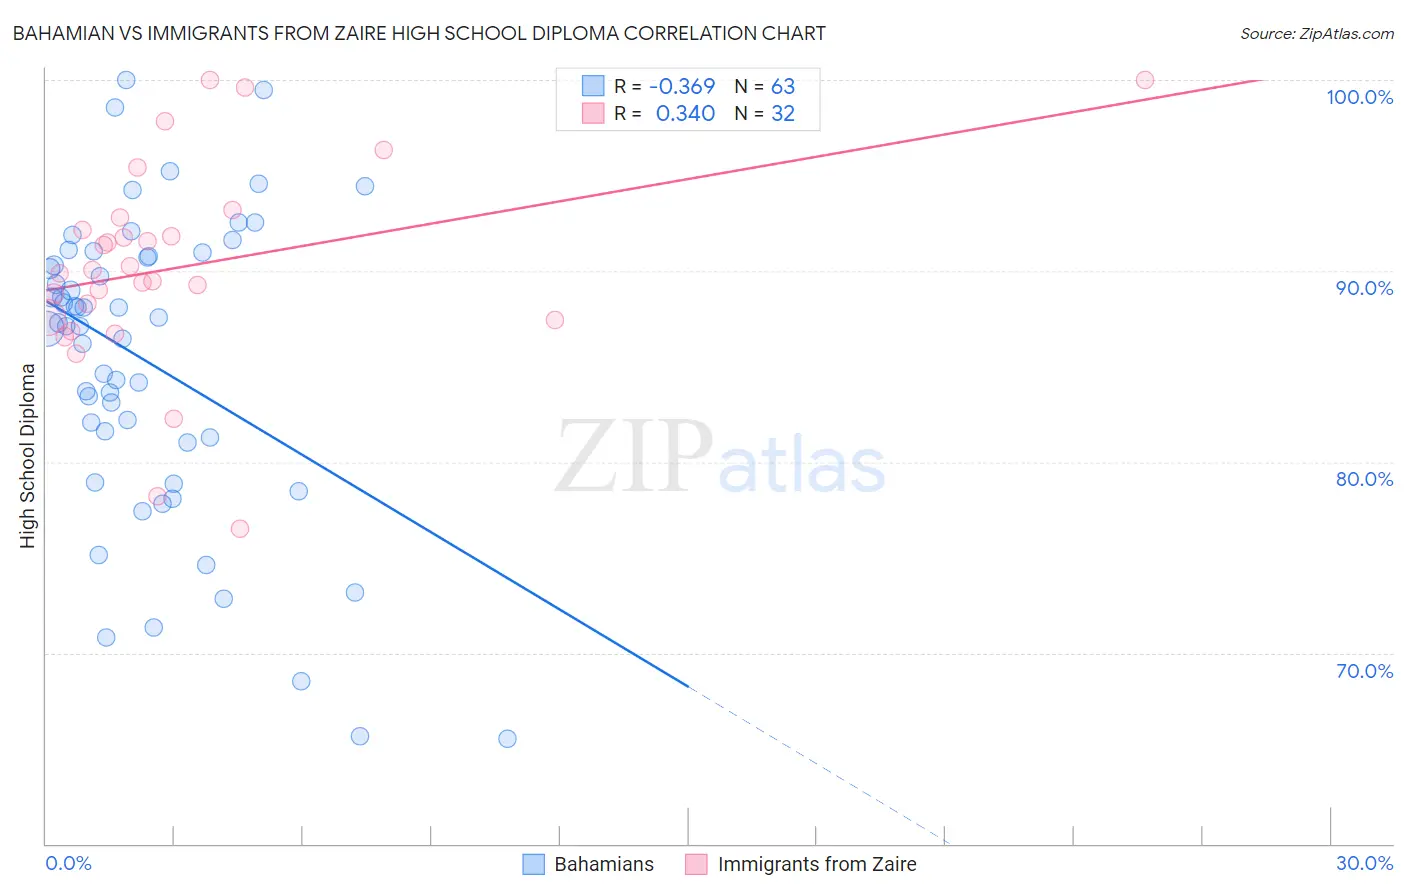
Bahamian vs Immigrants from Zaire High School Diploma Correlation Chart
The statistical analysis conducted on geographies consisting of 112,698,819 people shows a mild negative correlation between the proportion of Bahamians and percentage of population with at least high school diploma education in the United States with a correlation coefficient (R) of -0.369 and weighted average of 87.5%. Similarly, the statistical analysis conducted on geographies consisting of 107,255,805 people shows a mild positive correlation between the proportion of Immigrants from Zaire and percentage of population with at least high school diploma education in the United States with a correlation coefficient (R) of 0.340 and weighted average of 88.3%, a difference of 0.96%.
High School Diploma Correlation Summary
| Measurement | Bahamian | Immigrants from Zaire |
| Minimum | 65.5% | 76.5% |
| Maximum | 100.0% | 100.0% |
| Range | 34.5% | 23.5% |
| Mean | 85.2% | 90.2% |
| Median | 87.1% | 90.0% |
| Interquartile 25% (IQ1) | 81.0% | 87.5% |
| Interquartile 75% (IQ3) | 90.8% | 92.5% |
| Interquartile Range (IQR) | 9.8% | 5.0% |
| Standard Deviation (Sample) | 7.9% | 5.4% |
| Standard Deviation (Population) | 7.9% | 5.3% |
Similar Demographics by High School Diploma
Demographics Similar to Bahamians by High School Diploma
In terms of high school diploma, the demographic groups most similar to Bahamians are African (87.5%, a difference of 0.0%), Immigrants from Senegal (87.6%, a difference of 0.10%), Immigrants from Ghana (87.4%, a difference of 0.10%), Immigrants from Western Africa (87.4%, a difference of 0.11%), and Immigrants from Colombia (87.6%, a difference of 0.16%).
| Demographics | Rating | Rank | High School Diploma |
| Immigrants | Nigeria | 1.5 /100 | #250 | Tragic 87.7% |
| Ghanaians | 1.4 /100 | #251 | Tragic 87.7% |
| Immigrants | South America | 1.2 /100 | #252 | Tragic 87.6% |
| Immigrants | Uruguay | 1.0 /100 | #253 | Tragic 87.6% |
| Immigrants | Colombia | 1.0 /100 | #254 | Tragic 87.6% |
| Immigrants | Senegal | 0.9 /100 | #255 | Tragic 87.6% |
| Africans | 0.7 /100 | #256 | Tragic 87.5% |
| Bahamians | 0.7 /100 | #257 | Tragic 87.5% |
| Immigrants | Ghana | 0.5 /100 | #258 | Tragic 87.4% |
| Immigrants | Western Africa | 0.5 /100 | #259 | Tragic 87.4% |
| Cajuns | 0.4 /100 | #260 | Tragic 87.3% |
| Seminole | 0.4 /100 | #261 | Tragic 87.3% |
| Immigrants | Peru | 0.4 /100 | #262 | Tragic 87.3% |
| Immigrants | South Eastern Asia | 0.3 /100 | #263 | Tragic 87.2% |
| Jamaicans | 0.3 /100 | #264 | Tragic 87.2% |
Demographics Similar to Immigrants from Zaire by High School Diploma
In terms of high school diploma, the demographic groups most similar to Immigrants from Zaire are Colville (88.3%, a difference of 0.010%), Shoshone (88.3%, a difference of 0.040%), Creek (88.3%, a difference of 0.040%), Immigrants from Afghanistan (88.3%, a difference of 0.050%), and Tongan (88.4%, a difference of 0.090%).
| Demographics | Rating | Rank | High School Diploma |
| Chickasaw | 10.7 /100 | #216 | Poor 88.4% |
| Immigrants | Africa | 10.6 /100 | #217 | Poor 88.4% |
| Immigrants | Bolivia | 10.3 /100 | #218 | Poor 88.4% |
| Costa Ricans | 9.6 /100 | #219 | Tragic 88.4% |
| Tongans | 9.5 /100 | #220 | Tragic 88.4% |
| Immigrants | Afghanistan | 8.6 /100 | #221 | Tragic 88.3% |
| Colville | 7.8 /100 | #222 | Tragic 88.3% |
| Immigrants | Zaire | 7.6 /100 | #223 | Tragic 88.3% |
| Shoshone | 7.0 /100 | #224 | Tragic 88.3% |
| Creek | 6.9 /100 | #225 | Tragic 88.3% |
| Uruguayans | 5.6 /100 | #226 | Tragic 88.2% |
| Immigrants | Liberia | 5.5 /100 | #227 | Tragic 88.2% |
| Kiowa | 5.3 /100 | #228 | Tragic 88.2% |
| Nigerians | 5.2 /100 | #229 | Tragic 88.2% |
| Blackfeet | 4.2 /100 | #230 | Tragic 88.1% |