White/Caucasian vs Immigrants from Zaire High School Diploma
COMPARE
White/Caucasian
Immigrants from Zaire
High School Diploma
High School Diploma Comparison
Whites/Caucasians
Immigrants from Zaire
90.1%
HIGH SCHOOL DIPLOMA
94.1/ 100
METRIC RATING
121st/ 347
METRIC RANK
88.3%
HIGH SCHOOL DIPLOMA
7.6/ 100
METRIC RATING
223rd/ 347
METRIC RANK
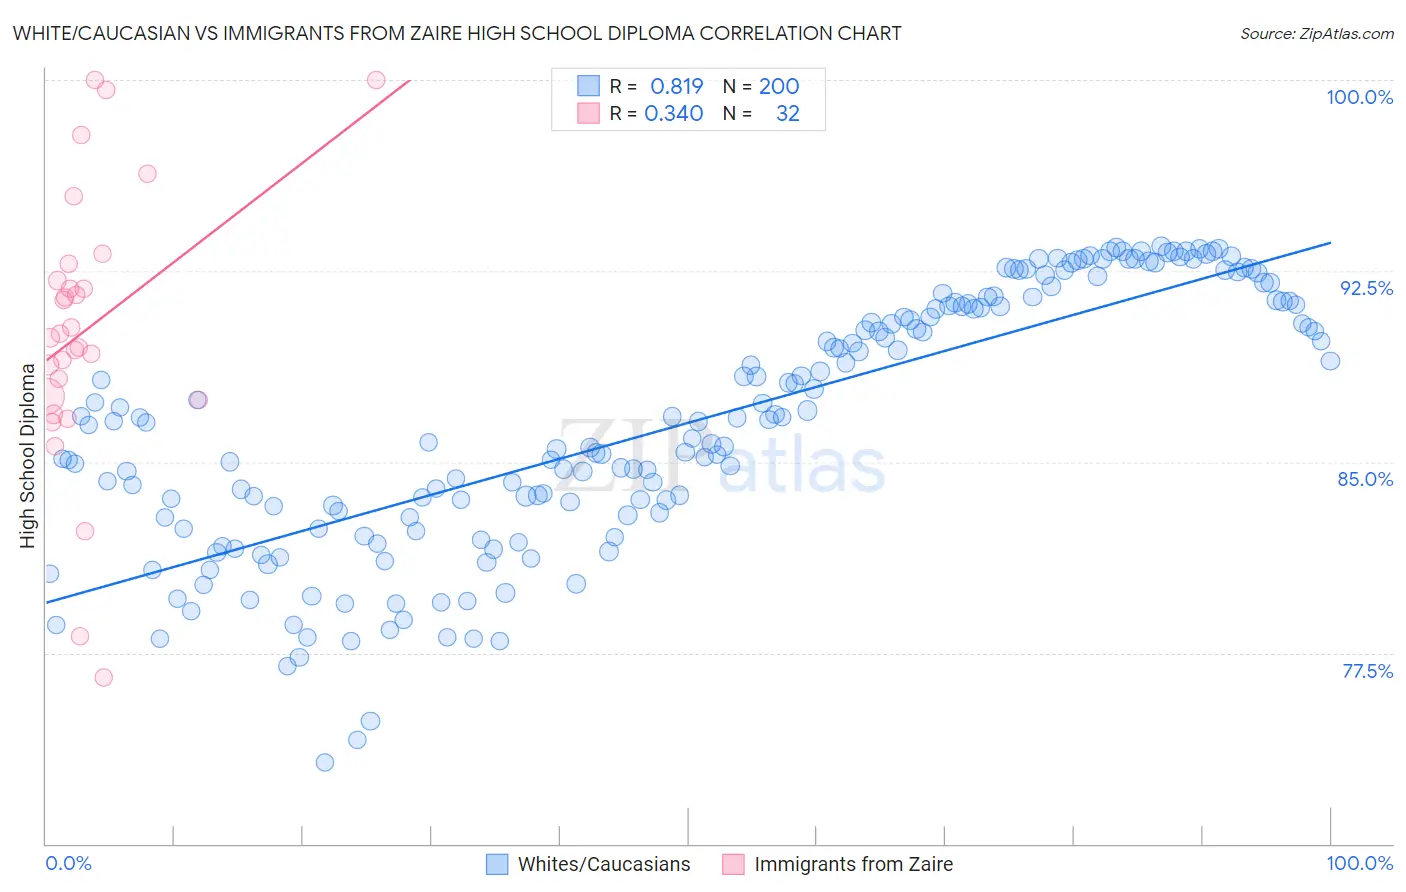
White/Caucasian vs Immigrants from Zaire High School Diploma Correlation Chart
The statistical analysis conducted on geographies consisting of 585,242,062 people shows a very strong positive correlation between the proportion of Whites/Caucasians and percentage of population with at least high school diploma education in the United States with a correlation coefficient (R) of 0.819 and weighted average of 90.1%. Similarly, the statistical analysis conducted on geographies consisting of 107,255,805 people shows a mild positive correlation between the proportion of Immigrants from Zaire and percentage of population with at least high school diploma education in the United States with a correlation coefficient (R) of 0.340 and weighted average of 88.3%, a difference of 2.0%.
High School Diploma Correlation Summary
| Measurement | White/Caucasian | Immigrants from Zaire |
| Minimum | 73.2% | 76.5% |
| Maximum | 93.5% | 100.0% |
| Range | 20.3% | 23.5% |
| Mean | 86.5% | 90.2% |
| Median | 86.6% | 90.0% |
| Interquartile 25% (IQ1) | 82.9% | 87.5% |
| Interquartile 75% (IQ3) | 91.2% | 92.5% |
| Interquartile Range (IQR) | 8.3% | 5.0% |
| Standard Deviation (Sample) | 5.0% | 5.4% |
| Standard Deviation (Population) | 5.0% | 5.3% |
Similar Demographics by High School Diploma
Demographics Similar to Whites/Caucasians by High School Diploma
In terms of high school diploma, the demographic groups most similar to Whites/Caucasians are Ottawa (90.1%, a difference of 0.020%), Immigrants from Kazakhstan (90.0%, a difference of 0.050%), Immigrants from Eastern Europe (90.1%, a difference of 0.060%), Israeli (90.1%, a difference of 0.070%), and Jordanian (90.2%, a difference of 0.10%).
| Demographics | Rating | Rank | High School Diploma |
| Yugoslavians | 96.2 /100 | #114 | Exceptional 90.2% |
| Immigrants | Hungary | 95.8 /100 | #115 | Exceptional 90.2% |
| Immigrants | Germany | 95.7 /100 | #116 | Exceptional 90.2% |
| Jordanians | 95.4 /100 | #117 | Exceptional 90.2% |
| Israelis | 95.1 /100 | #118 | Exceptional 90.1% |
| Immigrants | Eastern Europe | 94.9 /100 | #119 | Exceptional 90.1% |
| Ottawa | 94.4 /100 | #120 | Exceptional 90.1% |
| Whites/Caucasians | 94.1 /100 | #121 | Exceptional 90.1% |
| Immigrants | Kazakhstan | 93.4 /100 | #122 | Exceptional 90.0% |
| German Russians | 92.0 /100 | #123 | Exceptional 90.0% |
| Mongolians | 91.6 /100 | #124 | Exceptional 89.9% |
| Egyptians | 91.1 /100 | #125 | Exceptional 89.9% |
| Alaska Natives | 91.0 /100 | #126 | Exceptional 89.9% |
| Immigrants | Eastern Asia | 89.2 /100 | #127 | Excellent 89.9% |
| Puget Sound Salish | 89.1 /100 | #128 | Excellent 89.9% |
Demographics Similar to Immigrants from Zaire by High School Diploma
In terms of high school diploma, the demographic groups most similar to Immigrants from Zaire are Colville (88.3%, a difference of 0.010%), Shoshone (88.3%, a difference of 0.040%), Creek (88.3%, a difference of 0.040%), Immigrants from Afghanistan (88.3%, a difference of 0.050%), and Tongan (88.4%, a difference of 0.090%).
| Demographics | Rating | Rank | High School Diploma |
| Chickasaw | 10.7 /100 | #216 | Poor 88.4% |
| Immigrants | Africa | 10.6 /100 | #217 | Poor 88.4% |
| Immigrants | Bolivia | 10.3 /100 | #218 | Poor 88.4% |
| Costa Ricans | 9.6 /100 | #219 | Tragic 88.4% |
| Tongans | 9.5 /100 | #220 | Tragic 88.4% |
| Immigrants | Afghanistan | 8.6 /100 | #221 | Tragic 88.3% |
| Colville | 7.8 /100 | #222 | Tragic 88.3% |
| Immigrants | Zaire | 7.6 /100 | #223 | Tragic 88.3% |
| Shoshone | 7.0 /100 | #224 | Tragic 88.3% |
| Creek | 6.9 /100 | #225 | Tragic 88.3% |
| Uruguayans | 5.6 /100 | #226 | Tragic 88.2% |
| Immigrants | Liberia | 5.5 /100 | #227 | Tragic 88.2% |
| Kiowa | 5.3 /100 | #228 | Tragic 88.2% |
| Nigerians | 5.2 /100 | #229 | Tragic 88.2% |
| Blackfeet | 4.2 /100 | #230 | Tragic 88.1% |