Immigrants from Burma/Myanmar vs Immigrants from Honduras High School Diploma
COMPARE
Immigrants from Burma/Myanmar
Immigrants from Honduras
High School Diploma
High School Diploma Comparison
Immigrants from Burma/Myanmar
Immigrants from Honduras
86.7%
HIGH SCHOOL DIPLOMA
0.1/ 100
METRIC RATING
276th/ 347
METRIC RANK
82.5%
HIGH SCHOOL DIPLOMA
0.0/ 100
METRIC RATING
332nd/ 347
METRIC RANK
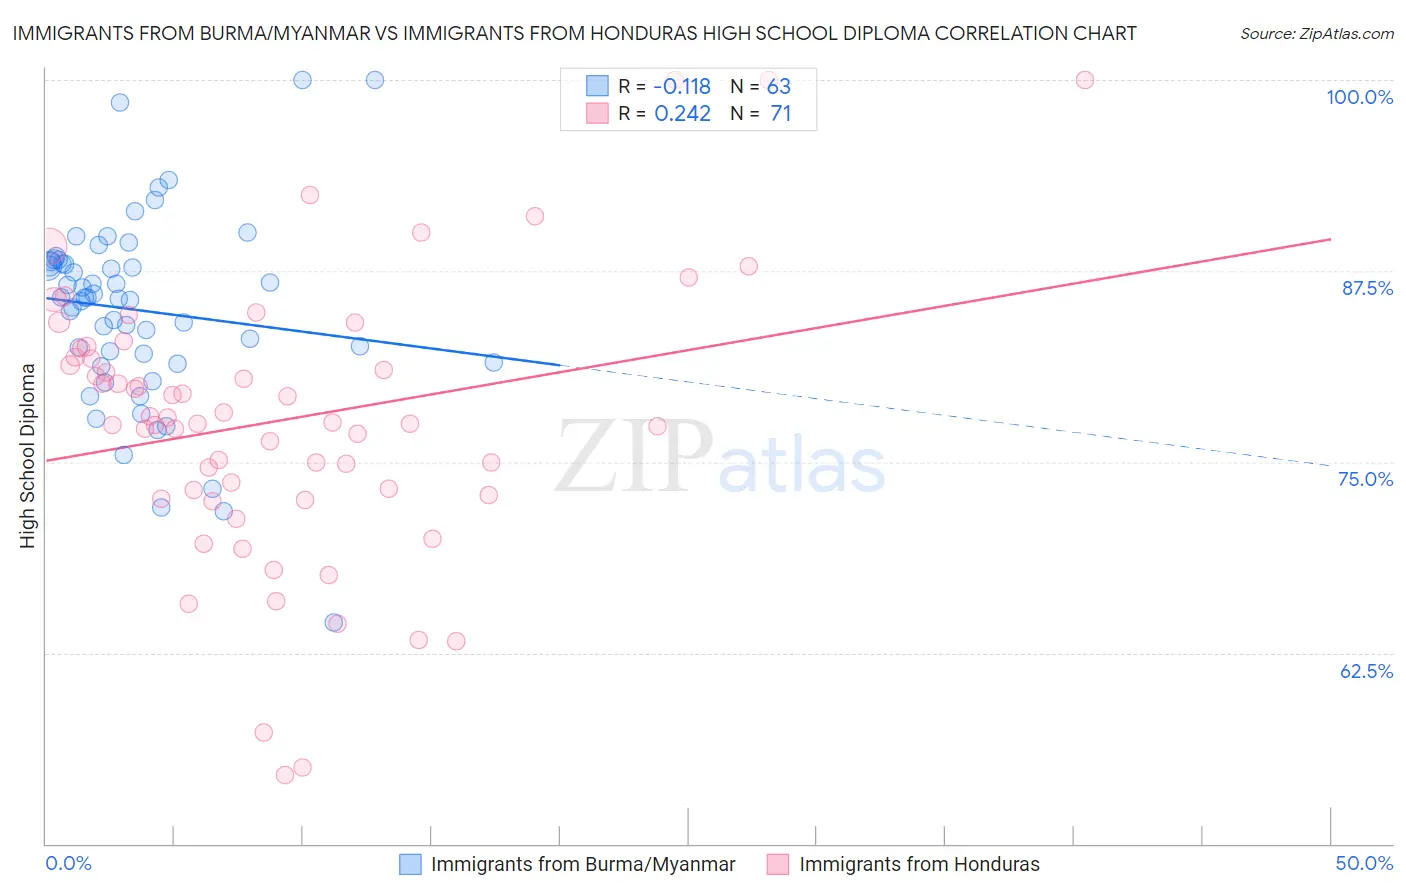
Immigrants from Burma/Myanmar vs Immigrants from Honduras High School Diploma Correlation Chart
The statistical analysis conducted on geographies consisting of 172,345,696 people shows a poor negative correlation between the proportion of Immigrants from Burma/Myanmar and percentage of population with at least high school diploma education in the United States with a correlation coefficient (R) of -0.118 and weighted average of 86.7%. Similarly, the statistical analysis conducted on geographies consisting of 322,637,368 people shows a weak positive correlation between the proportion of Immigrants from Honduras and percentage of population with at least high school diploma education in the United States with a correlation coefficient (R) of 0.242 and weighted average of 82.5%, a difference of 5.1%.
High School Diploma Correlation Summary
| Measurement | Immigrants from Burma/Myanmar | Immigrants from Honduras |
| Minimum | 64.5% | 54.5% |
| Maximum | 100.0% | 100.0% |
| Range | 35.5% | 45.5% |
| Mean | 84.9% | 77.7% |
| Median | 85.8% | 77.6% |
| Interquartile 25% (IQ1) | 81.5% | 72.8% |
| Interquartile 75% (IQ3) | 88.1% | 82.4% |
| Interquartile Range (IQR) | 6.6% | 9.6% |
| Standard Deviation (Sample) | 6.3% | 9.1% |
| Standard Deviation (Population) | 6.3% | 9.1% |
Similar Demographics by High School Diploma
Demographics Similar to Immigrants from Burma/Myanmar by High School Diploma
In terms of high school diploma, the demographic groups most similar to Immigrants from Burma/Myanmar are Barbadian (86.7%, a difference of 0.010%), Immigrants from Trinidad and Tobago (86.8%, a difference of 0.070%), Hopi (86.6%, a difference of 0.11%), Immigrants from Laos (86.6%, a difference of 0.16%), and Pueblo (86.5%, a difference of 0.18%).
| Demographics | Rating | Rank | High School Diploma |
| Sri Lankans | 0.2 /100 | #269 | Tragic 87.0% |
| Malaysians | 0.2 /100 | #270 | Tragic 87.0% |
| West Indians | 0.1 /100 | #271 | Tragic 86.9% |
| Trinidadians and Tobagonians | 0.1 /100 | #272 | Tragic 86.9% |
| Immigrants | Jamaica | 0.1 /100 | #273 | Tragic 86.9% |
| Bangladeshis | 0.1 /100 | #274 | Tragic 86.9% |
| Immigrants | Trinidad and Tobago | 0.1 /100 | #275 | Tragic 86.8% |
| Immigrants | Burma/Myanmar | 0.1 /100 | #276 | Tragic 86.7% |
| Barbadians | 0.1 /100 | #277 | Tragic 86.7% |
| Hopi | 0.1 /100 | #278 | Tragic 86.6% |
| Immigrants | Laos | 0.0 /100 | #279 | Tragic 86.6% |
| Pueblo | 0.0 /100 | #280 | Tragic 86.5% |
| Indonesians | 0.0 /100 | #281 | Tragic 86.5% |
| Dutch West Indians | 0.0 /100 | #282 | Tragic 86.5% |
| Immigrants | Barbados | 0.0 /100 | #283 | Tragic 86.4% |
Demographics Similar to Immigrants from Honduras by High School Diploma
In terms of high school diploma, the demographic groups most similar to Immigrants from Honduras are Central American (82.5%, a difference of 0.10%), Immigrants from Latin America (82.1%, a difference of 0.39%), Immigrants from the Azores (82.8%, a difference of 0.41%), Hispanic or Latino (82.9%, a difference of 0.49%), and Tohono O'odham (82.1%, a difference of 0.50%).
| Demographics | Rating | Rank | High School Diploma |
| Immigrants | Nicaragua | 0.0 /100 | #325 | Tragic 83.1% |
| Mexican American Indians | 0.0 /100 | #326 | Tragic 83.0% |
| Hondurans | 0.0 /100 | #327 | Tragic 83.0% |
| Dominicans | 0.0 /100 | #328 | Tragic 82.9% |
| Hispanics or Latinos | 0.0 /100 | #329 | Tragic 82.9% |
| Immigrants | Azores | 0.0 /100 | #330 | Tragic 82.8% |
| Central Americans | 0.0 /100 | #331 | Tragic 82.5% |
| Immigrants | Honduras | 0.0 /100 | #332 | Tragic 82.5% |
| Immigrants | Latin America | 0.0 /100 | #333 | Tragic 82.1% |
| Tohono O'odham | 0.0 /100 | #334 | Tragic 82.1% |
| Guatemalans | 0.0 /100 | #335 | Tragic 82.0% |
| Immigrants | Dominican Republic | 0.0 /100 | #336 | Tragic 82.0% |
| Immigrants | Yemen | 0.0 /100 | #337 | Tragic 81.8% |
| Salvadorans | 0.0 /100 | #338 | Tragic 81.7% |
| Pima | 0.0 /100 | #339 | Tragic 81.6% |