Immigrants from Western Africa vs Immigrants from Zaire High School Diploma
COMPARE
Immigrants from Western Africa
Immigrants from Zaire
High School Diploma
High School Diploma Comparison
Immigrants from Western Africa
Immigrants from Zaire
87.4%
HIGH SCHOOL DIPLOMA
0.5/ 100
METRIC RATING
259th/ 347
METRIC RANK
88.3%
HIGH SCHOOL DIPLOMA
7.6/ 100
METRIC RATING
223rd/ 347
METRIC RANK
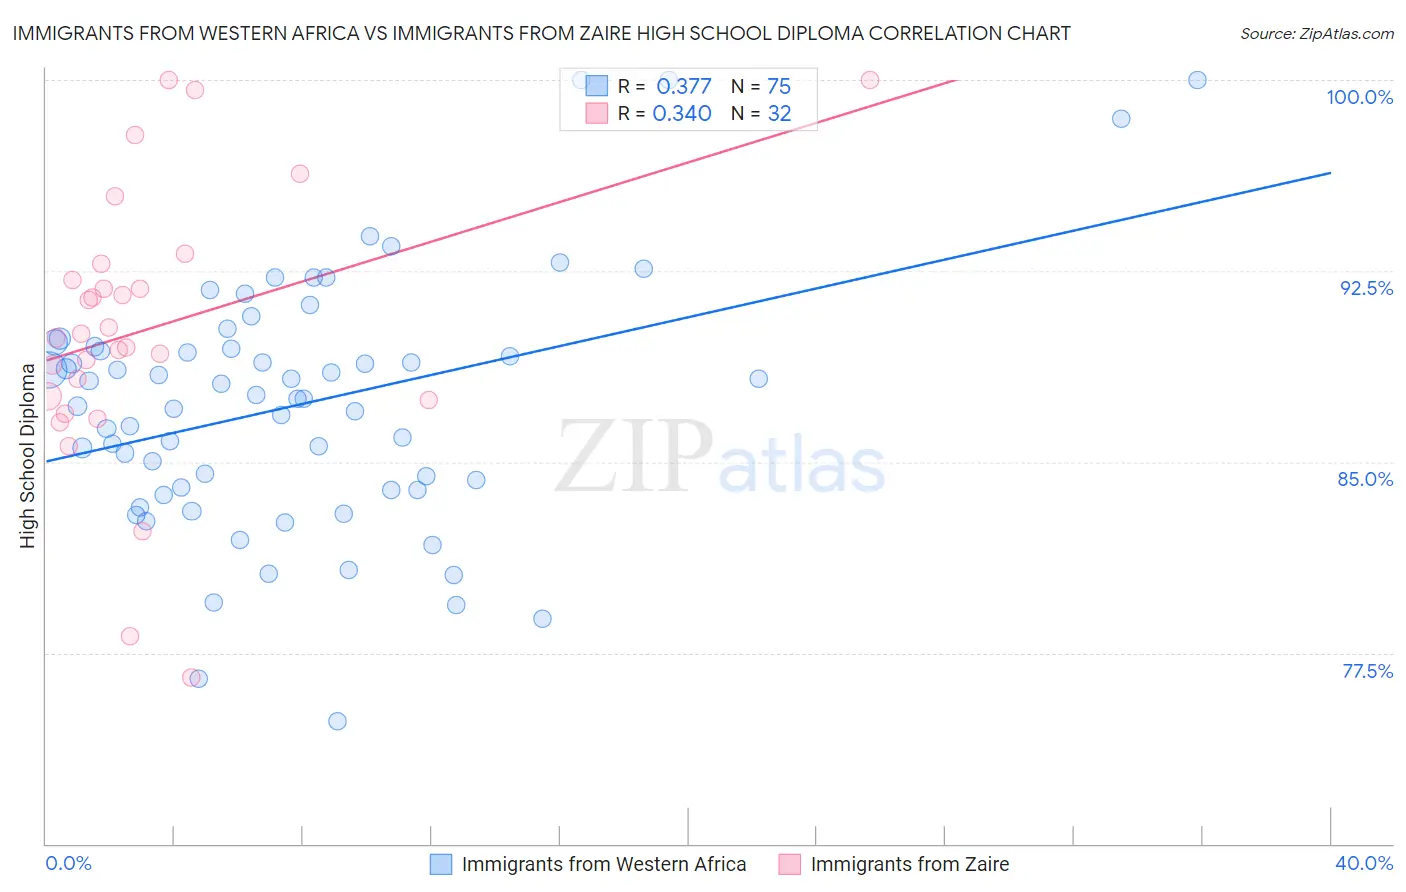
Immigrants from Western Africa vs Immigrants from Zaire High School Diploma Correlation Chart
The statistical analysis conducted on geographies consisting of 357,882,128 people shows a mild positive correlation between the proportion of Immigrants from Western Africa and percentage of population with at least high school diploma education in the United States with a correlation coefficient (R) of 0.377 and weighted average of 87.4%. Similarly, the statistical analysis conducted on geographies consisting of 107,255,805 people shows a mild positive correlation between the proportion of Immigrants from Zaire and percentage of population with at least high school diploma education in the United States with a correlation coefficient (R) of 0.340 and weighted average of 88.3%, a difference of 1.1%.
High School Diploma Correlation Summary
| Measurement | Immigrants from Western Africa | Immigrants from Zaire |
| Minimum | 74.8% | 76.5% |
| Maximum | 100.0% | 100.0% |
| Range | 25.2% | 23.5% |
| Mean | 87.3% | 90.2% |
| Median | 87.5% | 90.0% |
| Interquartile 25% (IQ1) | 83.9% | 87.5% |
| Interquartile 75% (IQ3) | 89.5% | 92.5% |
| Interquartile Range (IQR) | 5.6% | 5.0% |
| Standard Deviation (Sample) | 5.0% | 5.4% |
| Standard Deviation (Population) | 4.9% | 5.3% |
Similar Demographics by High School Diploma
Demographics Similar to Immigrants from Western Africa by High School Diploma
In terms of high school diploma, the demographic groups most similar to Immigrants from Western Africa are Immigrants from Ghana (87.4%, a difference of 0.010%), Cajun (87.3%, a difference of 0.080%), Seminole (87.3%, a difference of 0.10%), Bahamian (87.5%, a difference of 0.11%), and African (87.5%, a difference of 0.12%).
| Demographics | Rating | Rank | High School Diploma |
| Immigrants | South America | 1.2 /100 | #252 | Tragic 87.6% |
| Immigrants | Uruguay | 1.0 /100 | #253 | Tragic 87.6% |
| Immigrants | Colombia | 1.0 /100 | #254 | Tragic 87.6% |
| Immigrants | Senegal | 0.9 /100 | #255 | Tragic 87.6% |
| Africans | 0.7 /100 | #256 | Tragic 87.5% |
| Bahamians | 0.7 /100 | #257 | Tragic 87.5% |
| Immigrants | Ghana | 0.5 /100 | #258 | Tragic 87.4% |
| Immigrants | Western Africa | 0.5 /100 | #259 | Tragic 87.4% |
| Cajuns | 0.4 /100 | #260 | Tragic 87.3% |
| Seminole | 0.4 /100 | #261 | Tragic 87.3% |
| Immigrants | Peru | 0.4 /100 | #262 | Tragic 87.3% |
| Immigrants | South Eastern Asia | 0.3 /100 | #263 | Tragic 87.2% |
| Jamaicans | 0.3 /100 | #264 | Tragic 87.2% |
| U.S. Virgin Islanders | 0.2 /100 | #265 | Tragic 87.1% |
| Immigrants | Congo | 0.2 /100 | #266 | Tragic 87.0% |
Demographics Similar to Immigrants from Zaire by High School Diploma
In terms of high school diploma, the demographic groups most similar to Immigrants from Zaire are Colville (88.3%, a difference of 0.010%), Shoshone (88.3%, a difference of 0.040%), Creek (88.3%, a difference of 0.040%), Immigrants from Afghanistan (88.3%, a difference of 0.050%), and Tongan (88.4%, a difference of 0.090%).
| Demographics | Rating | Rank | High School Diploma |
| Chickasaw | 10.7 /100 | #216 | Poor 88.4% |
| Immigrants | Africa | 10.6 /100 | #217 | Poor 88.4% |
| Immigrants | Bolivia | 10.3 /100 | #218 | Poor 88.4% |
| Costa Ricans | 9.6 /100 | #219 | Tragic 88.4% |
| Tongans | 9.5 /100 | #220 | Tragic 88.4% |
| Immigrants | Afghanistan | 8.6 /100 | #221 | Tragic 88.3% |
| Colville | 7.8 /100 | #222 | Tragic 88.3% |
| Immigrants | Zaire | 7.6 /100 | #223 | Tragic 88.3% |
| Shoshone | 7.0 /100 | #224 | Tragic 88.3% |
| Creek | 6.9 /100 | #225 | Tragic 88.3% |
| Uruguayans | 5.6 /100 | #226 | Tragic 88.2% |
| Immigrants | Liberia | 5.5 /100 | #227 | Tragic 88.2% |
| Kiowa | 5.3 /100 | #228 | Tragic 88.2% |
| Nigerians | 5.2 /100 | #229 | Tragic 88.2% |
| Blackfeet | 4.2 /100 | #230 | Tragic 88.1% |