Immigrants from Burma/Myanmar vs Immigrants from Senegal High School Diploma
COMPARE
Immigrants from Burma/Myanmar
Immigrants from Senegal
High School Diploma
High School Diploma Comparison
Immigrants from Burma/Myanmar
Immigrants from Senegal
86.7%
HIGH SCHOOL DIPLOMA
0.1/ 100
METRIC RATING
276th/ 347
METRIC RANK
87.6%
HIGH SCHOOL DIPLOMA
0.9/ 100
METRIC RATING
255th/ 347
METRIC RANK
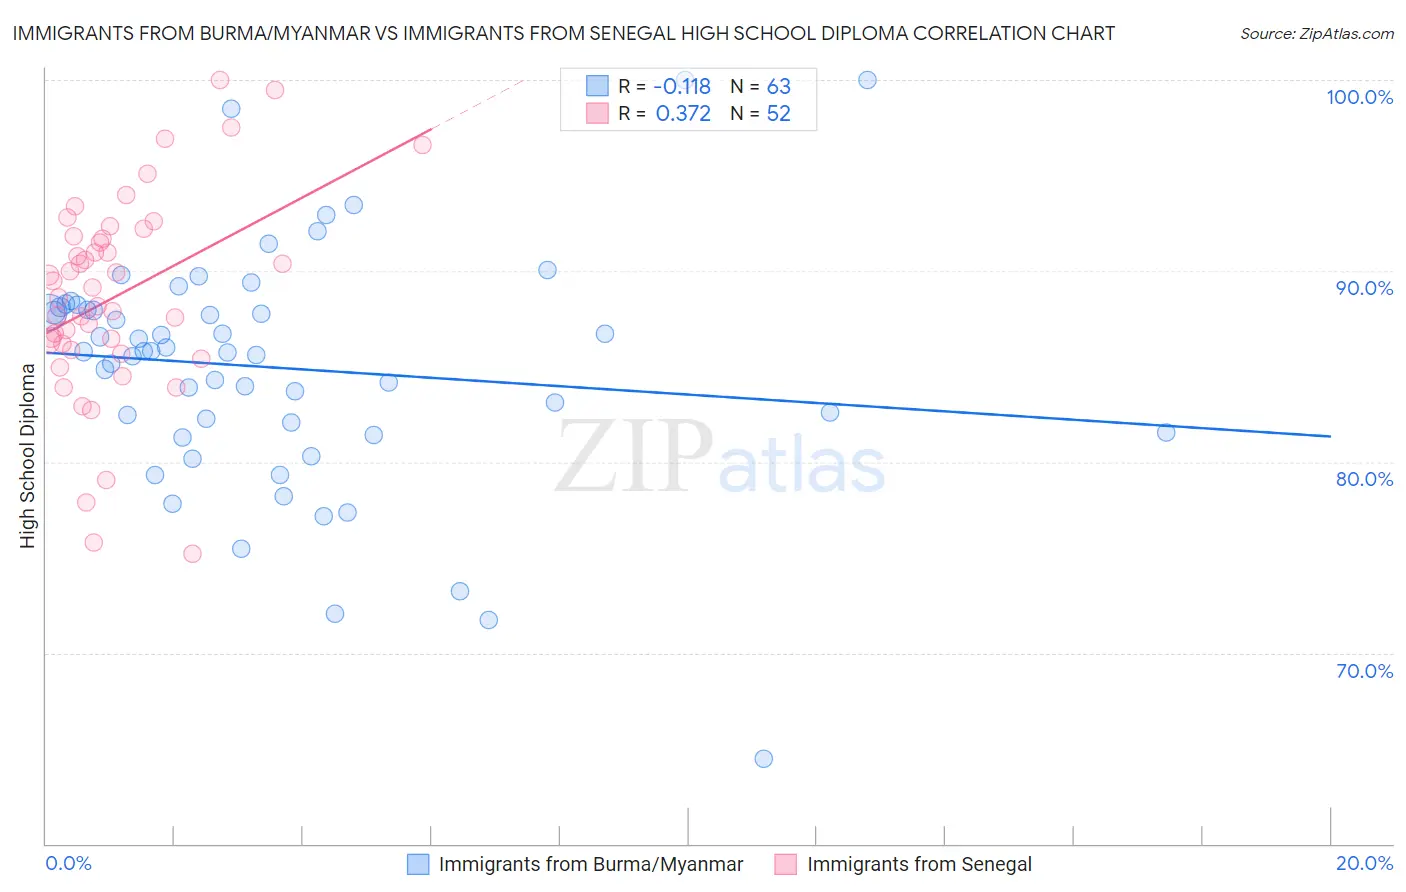
Immigrants from Burma/Myanmar vs Immigrants from Senegal High School Diploma Correlation Chart
The statistical analysis conducted on geographies consisting of 172,345,696 people shows a poor negative correlation between the proportion of Immigrants from Burma/Myanmar and percentage of population with at least high school diploma education in the United States with a correlation coefficient (R) of -0.118 and weighted average of 86.7%. Similarly, the statistical analysis conducted on geographies consisting of 90,130,297 people shows a mild positive correlation between the proportion of Immigrants from Senegal and percentage of population with at least high school diploma education in the United States with a correlation coefficient (R) of 0.372 and weighted average of 87.6%, a difference of 0.99%.
High School Diploma Correlation Summary
| Measurement | Immigrants from Burma/Myanmar | Immigrants from Senegal |
| Minimum | 64.5% | 75.2% |
| Maximum | 100.0% | 100.0% |
| Range | 35.5% | 24.8% |
| Mean | 84.9% | 88.7% |
| Median | 85.8% | 88.9% |
| Interquartile 25% (IQ1) | 81.5% | 86.0% |
| Interquartile 75% (IQ3) | 88.1% | 91.7% |
| Interquartile Range (IQR) | 6.6% | 5.7% |
| Standard Deviation (Sample) | 6.3% | 5.3% |
| Standard Deviation (Population) | 6.3% | 5.2% |
Similar Demographics by High School Diploma
Demographics Similar to Immigrants from Burma/Myanmar by High School Diploma
In terms of high school diploma, the demographic groups most similar to Immigrants from Burma/Myanmar are Barbadian (86.7%, a difference of 0.010%), Immigrants from Trinidad and Tobago (86.8%, a difference of 0.070%), Hopi (86.6%, a difference of 0.11%), Immigrants from Laos (86.6%, a difference of 0.16%), and Pueblo (86.5%, a difference of 0.18%).
| Demographics | Rating | Rank | High School Diploma |
| Sri Lankans | 0.2 /100 | #269 | Tragic 87.0% |
| Malaysians | 0.2 /100 | #270 | Tragic 87.0% |
| West Indians | 0.1 /100 | #271 | Tragic 86.9% |
| Trinidadians and Tobagonians | 0.1 /100 | #272 | Tragic 86.9% |
| Immigrants | Jamaica | 0.1 /100 | #273 | Tragic 86.9% |
| Bangladeshis | 0.1 /100 | #274 | Tragic 86.9% |
| Immigrants | Trinidad and Tobago | 0.1 /100 | #275 | Tragic 86.8% |
| Immigrants | Burma/Myanmar | 0.1 /100 | #276 | Tragic 86.7% |
| Barbadians | 0.1 /100 | #277 | Tragic 86.7% |
| Hopi | 0.1 /100 | #278 | Tragic 86.6% |
| Immigrants | Laos | 0.0 /100 | #279 | Tragic 86.6% |
| Pueblo | 0.0 /100 | #280 | Tragic 86.5% |
| Indonesians | 0.0 /100 | #281 | Tragic 86.5% |
| Dutch West Indians | 0.0 /100 | #282 | Tragic 86.5% |
| Immigrants | Barbados | 0.0 /100 | #283 | Tragic 86.4% |
Demographics Similar to Immigrants from Senegal by High School Diploma
In terms of high school diploma, the demographic groups most similar to Immigrants from Senegal are Immigrants from Uruguay (87.6%, a difference of 0.060%), Immigrants from Colombia (87.6%, a difference of 0.060%), African (87.5%, a difference of 0.10%), Bahamian (87.5%, a difference of 0.10%), and Immigrants from South America (87.6%, a difference of 0.11%).
| Demographics | Rating | Rank | High School Diploma |
| Spanish Americans | 1.5 /100 | #248 | Tragic 87.7% |
| Senegalese | 1.5 /100 | #249 | Tragic 87.7% |
| Immigrants | Nigeria | 1.5 /100 | #250 | Tragic 87.7% |
| Ghanaians | 1.4 /100 | #251 | Tragic 87.7% |
| Immigrants | South America | 1.2 /100 | #252 | Tragic 87.6% |
| Immigrants | Uruguay | 1.0 /100 | #253 | Tragic 87.6% |
| Immigrants | Colombia | 1.0 /100 | #254 | Tragic 87.6% |
| Immigrants | Senegal | 0.9 /100 | #255 | Tragic 87.6% |
| Africans | 0.7 /100 | #256 | Tragic 87.5% |
| Bahamians | 0.7 /100 | #257 | Tragic 87.5% |
| Immigrants | Ghana | 0.5 /100 | #258 | Tragic 87.4% |
| Immigrants | Western Africa | 0.5 /100 | #259 | Tragic 87.4% |
| Cajuns | 0.4 /100 | #260 | Tragic 87.3% |
| Seminole | 0.4 /100 | #261 | Tragic 87.3% |
| Immigrants | Peru | 0.4 /100 | #262 | Tragic 87.3% |