Immigrants from Burma/Myanmar vs Immigrants from Eastern Europe High School Diploma
COMPARE
Immigrants from Burma/Myanmar
Immigrants from Eastern Europe
High School Diploma
High School Diploma Comparison
Immigrants from Burma/Myanmar
Immigrants from Eastern Europe
86.7%
HIGH SCHOOL DIPLOMA
0.1/ 100
METRIC RATING
276th/ 347
METRIC RANK
90.1%
HIGH SCHOOL DIPLOMA
94.9/ 100
METRIC RATING
119th/ 347
METRIC RANK
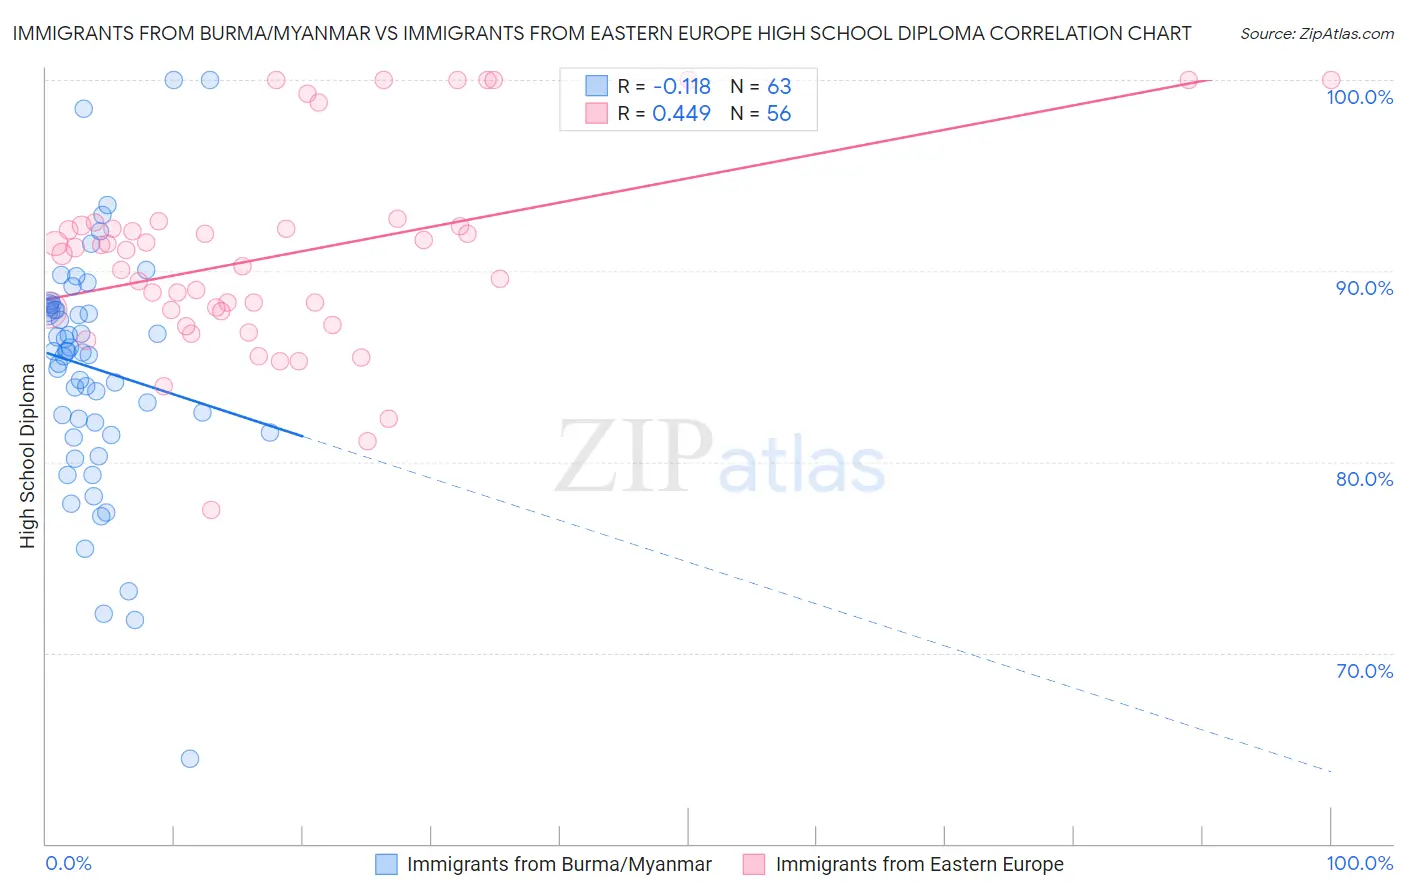
Immigrants from Burma/Myanmar vs Immigrants from Eastern Europe High School Diploma Correlation Chart
The statistical analysis conducted on geographies consisting of 172,345,696 people shows a poor negative correlation between the proportion of Immigrants from Burma/Myanmar and percentage of population with at least high school diploma education in the United States with a correlation coefficient (R) of -0.118 and weighted average of 86.7%. Similarly, the statistical analysis conducted on geographies consisting of 475,879,420 people shows a moderate positive correlation between the proportion of Immigrants from Eastern Europe and percentage of population with at least high school diploma education in the United States with a correlation coefficient (R) of 0.449 and weighted average of 90.1%, a difference of 4.0%.
High School Diploma Correlation Summary
| Measurement | Immigrants from Burma/Myanmar | Immigrants from Eastern Europe |
| Minimum | 64.5% | 77.4% |
| Maximum | 100.0% | 100.0% |
| Range | 35.5% | 22.6% |
| Mean | 84.9% | 90.8% |
| Median | 85.8% | 91.0% |
| Interquartile 25% (IQ1) | 81.5% | 87.9% |
| Interquartile 75% (IQ3) | 88.1% | 92.4% |
| Interquartile Range (IQR) | 6.6% | 4.5% |
| Standard Deviation (Sample) | 6.3% | 5.2% |
| Standard Deviation (Population) | 6.3% | 5.2% |
Similar Demographics by High School Diploma
Demographics Similar to Immigrants from Burma/Myanmar by High School Diploma
In terms of high school diploma, the demographic groups most similar to Immigrants from Burma/Myanmar are Barbadian (86.7%, a difference of 0.010%), Immigrants from Trinidad and Tobago (86.8%, a difference of 0.070%), Hopi (86.6%, a difference of 0.11%), Immigrants from Laos (86.6%, a difference of 0.16%), and Pueblo (86.5%, a difference of 0.18%).
| Demographics | Rating | Rank | High School Diploma |
| Sri Lankans | 0.2 /100 | #269 | Tragic 87.0% |
| Malaysians | 0.2 /100 | #270 | Tragic 87.0% |
| West Indians | 0.1 /100 | #271 | Tragic 86.9% |
| Trinidadians and Tobagonians | 0.1 /100 | #272 | Tragic 86.9% |
| Immigrants | Jamaica | 0.1 /100 | #273 | Tragic 86.9% |
| Bangladeshis | 0.1 /100 | #274 | Tragic 86.9% |
| Immigrants | Trinidad and Tobago | 0.1 /100 | #275 | Tragic 86.8% |
| Immigrants | Burma/Myanmar | 0.1 /100 | #276 | Tragic 86.7% |
| Barbadians | 0.1 /100 | #277 | Tragic 86.7% |
| Hopi | 0.1 /100 | #278 | Tragic 86.6% |
| Immigrants | Laos | 0.0 /100 | #279 | Tragic 86.6% |
| Pueblo | 0.0 /100 | #280 | Tragic 86.5% |
| Indonesians | 0.0 /100 | #281 | Tragic 86.5% |
| Dutch West Indians | 0.0 /100 | #282 | Tragic 86.5% |
| Immigrants | Barbados | 0.0 /100 | #283 | Tragic 86.4% |
Demographics Similar to Immigrants from Eastern Europe by High School Diploma
In terms of high school diploma, the demographic groups most similar to Immigrants from Eastern Europe are Israeli (90.1%, a difference of 0.020%), Ottawa (90.1%, a difference of 0.030%), Jordanian (90.2%, a difference of 0.040%), White/Caucasian (90.1%, a difference of 0.060%), and Immigrants from Germany (90.2%, a difference of 0.070%).
| Demographics | Rating | Rank | High School Diploma |
| Immigrants | Belarus | 96.4 /100 | #112 | Exceptional 90.2% |
| Immigrants | Sri Lanka | 96.3 /100 | #113 | Exceptional 90.2% |
| Yugoslavians | 96.2 /100 | #114 | Exceptional 90.2% |
| Immigrants | Hungary | 95.8 /100 | #115 | Exceptional 90.2% |
| Immigrants | Germany | 95.7 /100 | #116 | Exceptional 90.2% |
| Jordanians | 95.4 /100 | #117 | Exceptional 90.2% |
| Israelis | 95.1 /100 | #118 | Exceptional 90.1% |
| Immigrants | Eastern Europe | 94.9 /100 | #119 | Exceptional 90.1% |
| Ottawa | 94.4 /100 | #120 | Exceptional 90.1% |
| Whites/Caucasians | 94.1 /100 | #121 | Exceptional 90.1% |
| Immigrants | Kazakhstan | 93.4 /100 | #122 | Exceptional 90.0% |
| German Russians | 92.0 /100 | #123 | Exceptional 90.0% |
| Mongolians | 91.6 /100 | #124 | Exceptional 89.9% |
| Egyptians | 91.1 /100 | #125 | Exceptional 89.9% |
| Alaska Natives | 91.0 /100 | #126 | Exceptional 89.9% |