Immigrants from Burma/Myanmar vs Belizean High School Diploma
COMPARE
Immigrants from Burma/Myanmar
Belizean
High School Diploma
High School Diploma Comparison
Immigrants from Burma/Myanmar
Belizeans
86.7%
HIGH SCHOOL DIPLOMA
0.1/ 100
METRIC RATING
276th/ 347
METRIC RANK
84.3%
HIGH SCHOOL DIPLOMA
0.0/ 100
METRIC RATING
316th/ 347
METRIC RANK
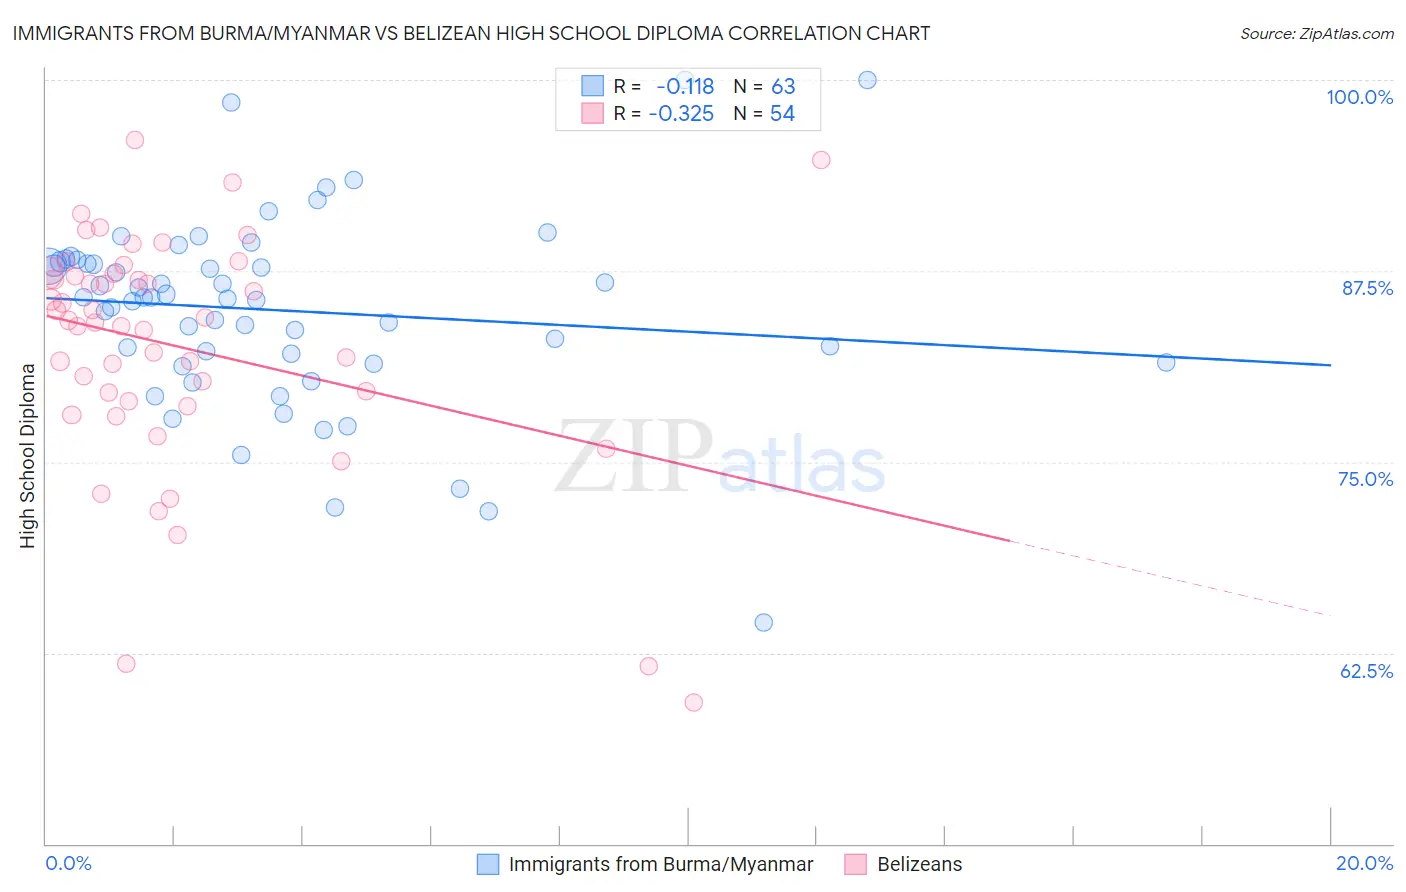
Immigrants from Burma/Myanmar vs Belizean High School Diploma Correlation Chart
The statistical analysis conducted on geographies consisting of 172,345,696 people shows a poor negative correlation between the proportion of Immigrants from Burma/Myanmar and percentage of population with at least high school diploma education in the United States with a correlation coefficient (R) of -0.118 and weighted average of 86.7%. Similarly, the statistical analysis conducted on geographies consisting of 144,225,006 people shows a mild negative correlation between the proportion of Belizeans and percentage of population with at least high school diploma education in the United States with a correlation coefficient (R) of -0.325 and weighted average of 84.3%, a difference of 2.8%.
High School Diploma Correlation Summary
| Measurement | Immigrants from Burma/Myanmar | Belizean |
| Minimum | 64.5% | 59.3% |
| Maximum | 100.0% | 96.1% |
| Range | 35.5% | 36.8% |
| Mean | 84.9% | 82.5% |
| Median | 85.8% | 84.2% |
| Interquartile 25% (IQ1) | 81.5% | 79.0% |
| Interquartile 75% (IQ3) | 88.1% | 87.3% |
| Interquartile Range (IQR) | 6.6% | 8.3% |
| Standard Deviation (Sample) | 6.3% | 7.8% |
| Standard Deviation (Population) | 6.3% | 7.7% |
Similar Demographics by High School Diploma
Demographics Similar to Immigrants from Burma/Myanmar by High School Diploma
In terms of high school diploma, the demographic groups most similar to Immigrants from Burma/Myanmar are Barbadian (86.7%, a difference of 0.010%), Immigrants from Trinidad and Tobago (86.8%, a difference of 0.070%), Hopi (86.6%, a difference of 0.11%), Immigrants from Laos (86.6%, a difference of 0.16%), and Pueblo (86.5%, a difference of 0.18%).
| Demographics | Rating | Rank | High School Diploma |
| Sri Lankans | 0.2 /100 | #269 | Tragic 87.0% |
| Malaysians | 0.2 /100 | #270 | Tragic 87.0% |
| West Indians | 0.1 /100 | #271 | Tragic 86.9% |
| Trinidadians and Tobagonians | 0.1 /100 | #272 | Tragic 86.9% |
| Immigrants | Jamaica | 0.1 /100 | #273 | Tragic 86.9% |
| Bangladeshis | 0.1 /100 | #274 | Tragic 86.9% |
| Immigrants | Trinidad and Tobago | 0.1 /100 | #275 | Tragic 86.8% |
| Immigrants | Burma/Myanmar | 0.1 /100 | #276 | Tragic 86.7% |
| Barbadians | 0.1 /100 | #277 | Tragic 86.7% |
| Hopi | 0.1 /100 | #278 | Tragic 86.6% |
| Immigrants | Laos | 0.0 /100 | #279 | Tragic 86.6% |
| Pueblo | 0.0 /100 | #280 | Tragic 86.5% |
| Indonesians | 0.0 /100 | #281 | Tragic 86.5% |
| Dutch West Indians | 0.0 /100 | #282 | Tragic 86.5% |
| Immigrants | Barbados | 0.0 /100 | #283 | Tragic 86.4% |
Demographics Similar to Belizeans by High School Diploma
In terms of high school diploma, the demographic groups most similar to Belizeans are Immigrants from Caribbean (84.3%, a difference of 0.060%), Immigrants from Belize (84.2%, a difference of 0.13%), Central American Indian (84.2%, a difference of 0.16%), Nicaraguan (84.1%, a difference of 0.26%), and Puerto Rican (84.7%, a difference of 0.40%).
| Demographics | Rating | Rank | High School Diploma |
| Immigrants | Dominica | 0.0 /100 | #309 | Tragic 85.2% |
| Apache | 0.0 /100 | #310 | Tragic 85.1% |
| Ecuadorians | 0.0 /100 | #311 | Tragic 85.1% |
| Cape Verdeans | 0.0 /100 | #312 | Tragic 85.1% |
| Immigrants | Ecuador | 0.0 /100 | #313 | Tragic 84.8% |
| Yaqui | 0.0 /100 | #314 | Tragic 84.7% |
| Puerto Ricans | 0.0 /100 | #315 | Tragic 84.7% |
| Belizeans | 0.0 /100 | #316 | Tragic 84.3% |
| Immigrants | Caribbean | 0.0 /100 | #317 | Tragic 84.3% |
| Immigrants | Belize | 0.0 /100 | #318 | Tragic 84.2% |
| Central American Indians | 0.0 /100 | #319 | Tragic 84.2% |
| Nicaraguans | 0.0 /100 | #320 | Tragic 84.1% |
| Yuman | 0.0 /100 | #321 | Tragic 84.0% |
| Lumbee | 0.0 /100 | #322 | Tragic 83.6% |
| Immigrants | Cuba | 0.0 /100 | #323 | Tragic 83.5% |