Comanche vs Immigrants from Zaire High School Diploma
COMPARE
Comanche
Immigrants from Zaire
High School Diploma
High School Diploma Comparison
Comanche
Immigrants from Zaire
87.9%
HIGH SCHOOL DIPLOMA
2.2/ 100
METRIC RATING
240th/ 347
METRIC RANK
88.3%
HIGH SCHOOL DIPLOMA
7.6/ 100
METRIC RATING
223rd/ 347
METRIC RANK
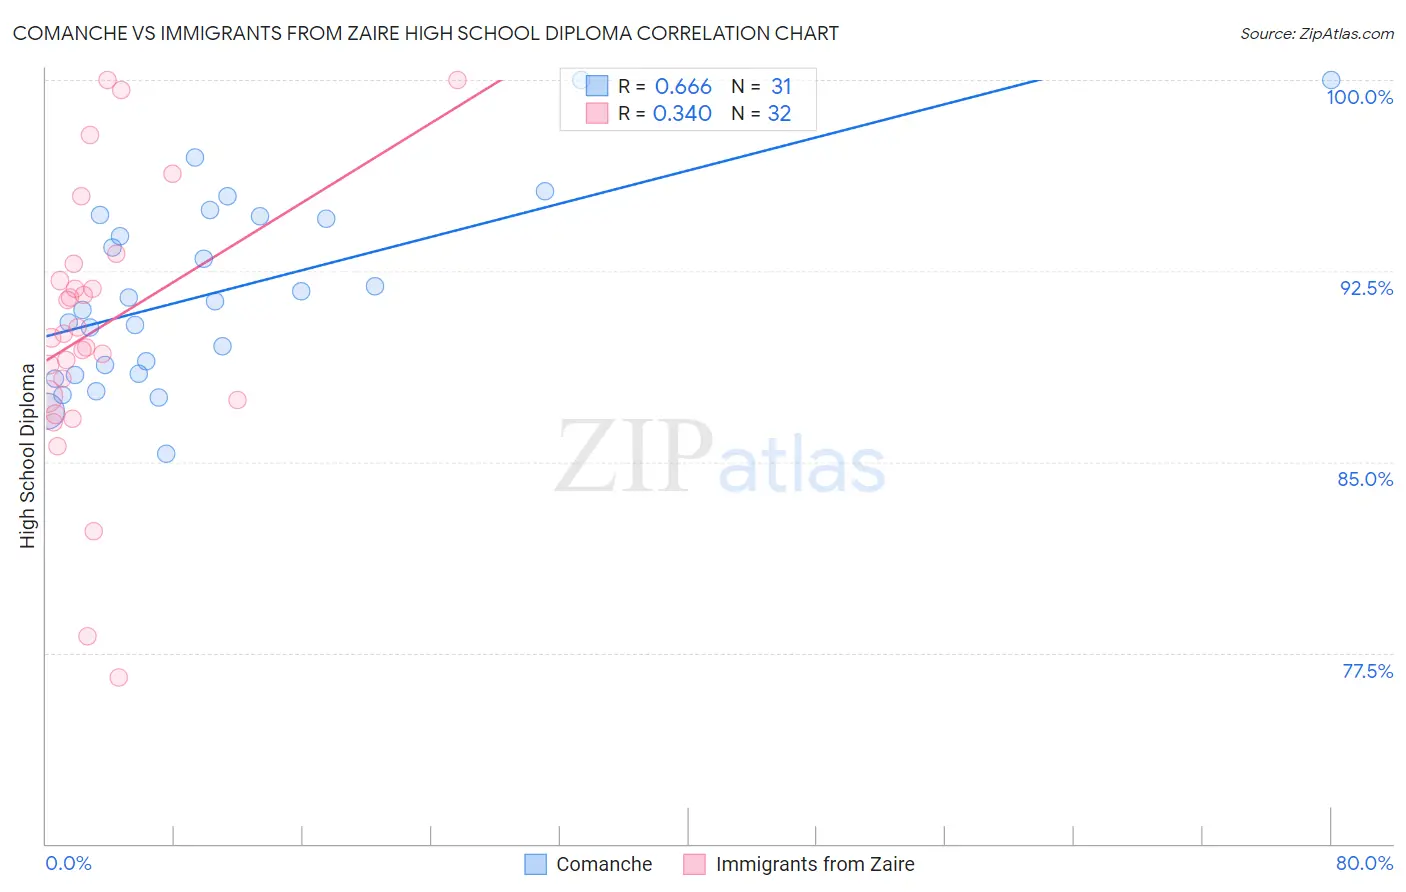
Comanche vs Immigrants from Zaire High School Diploma Correlation Chart
The statistical analysis conducted on geographies consisting of 109,786,530 people shows a significant positive correlation between the proportion of Comanche and percentage of population with at least high school diploma education in the United States with a correlation coefficient (R) of 0.666 and weighted average of 87.9%. Similarly, the statistical analysis conducted on geographies consisting of 107,255,805 people shows a mild positive correlation between the proportion of Immigrants from Zaire and percentage of population with at least high school diploma education in the United States with a correlation coefficient (R) of 0.340 and weighted average of 88.3%, a difference of 0.49%.
High School Diploma Correlation Summary
| Measurement | Comanche | Immigrants from Zaire |
| Minimum | 85.3% | 76.5% |
| Maximum | 100.0% | 100.0% |
| Range | 14.7% | 23.5% |
| Mean | 91.7% | 90.2% |
| Median | 91.3% | 90.0% |
| Interquartile 25% (IQ1) | 88.5% | 87.5% |
| Interquartile 75% (IQ3) | 94.6% | 92.5% |
| Interquartile Range (IQR) | 6.2% | 5.0% |
| Standard Deviation (Sample) | 3.7% | 5.4% |
| Standard Deviation (Population) | 3.6% | 5.3% |
Demographics Similar to Comanche and Immigrants from Zaire by High School Diploma
In terms of high school diploma, the demographic groups most similar to Comanche are Immigrants from Uzbekistan (87.8%, a difference of 0.030%), Taiwanese (87.9%, a difference of 0.080%), Sioux (87.9%, a difference of 0.080%), South American (87.9%, a difference of 0.080%), and Subsaharan African (87.9%, a difference of 0.090%). Similarly, the demographic groups most similar to Immigrants from Zaire are Colville (88.3%, a difference of 0.010%), Shoshone (88.3%, a difference of 0.040%), Creek (88.3%, a difference of 0.040%), Immigrants from Afghanistan (88.3%, a difference of 0.050%), and Uruguayan (88.2%, a difference of 0.12%).
| Demographics | Rating | Rank | High School Diploma |
| Immigrants | Afghanistan | 8.6 /100 | #221 | Tragic 88.3% |
| Colville | 7.8 /100 | #222 | Tragic 88.3% |
| Immigrants | Zaire | 7.6 /100 | #223 | Tragic 88.3% |
| Shoshone | 7.0 /100 | #224 | Tragic 88.3% |
| Creek | 6.9 /100 | #225 | Tragic 88.3% |
| Uruguayans | 5.6 /100 | #226 | Tragic 88.2% |
| Immigrants | Liberia | 5.5 /100 | #227 | Tragic 88.2% |
| Kiowa | 5.3 /100 | #228 | Tragic 88.2% |
| Nigerians | 5.2 /100 | #229 | Tragic 88.2% |
| Blackfeet | 4.2 /100 | #230 | Tragic 88.1% |
| Colombians | 3.8 /100 | #231 | Tragic 88.1% |
| Immigrants | Middle Africa | 3.4 /100 | #232 | Tragic 88.0% |
| Immigrants | Panama | 3.1 /100 | #233 | Tragic 88.0% |
| Immigrants | Thailand | 3.1 /100 | #234 | Tragic 88.0% |
| Immigrants | Bahamas | 2.9 /100 | #235 | Tragic 88.0% |
| Sub-Saharan Africans | 2.8 /100 | #236 | Tragic 87.9% |
| Taiwanese | 2.8 /100 | #237 | Tragic 87.9% |
| Sioux | 2.7 /100 | #238 | Tragic 87.9% |
| South Americans | 2.7 /100 | #239 | Tragic 87.9% |
| Comanche | 2.2 /100 | #240 | Tragic 87.9% |
| Immigrants | Uzbekistan | 2.1 /100 | #241 | Tragic 87.8% |