Immigrants from Burma/Myanmar vs Immigrants from Zaire Doctorate Degree
COMPARE
Immigrants from Burma/Myanmar
Immigrants from Zaire
Doctorate Degree
Doctorate Degree Comparison
Immigrants from Burma/Myanmar
Immigrants from Zaire
1.7%
DOCTORATE DEGREE
13.5/ 100
METRIC RATING
216th/ 347
METRIC RANK
2.0%
DOCTORATE DEGREE
91.1/ 100
METRIC RATING
128th/ 347
METRIC RANK
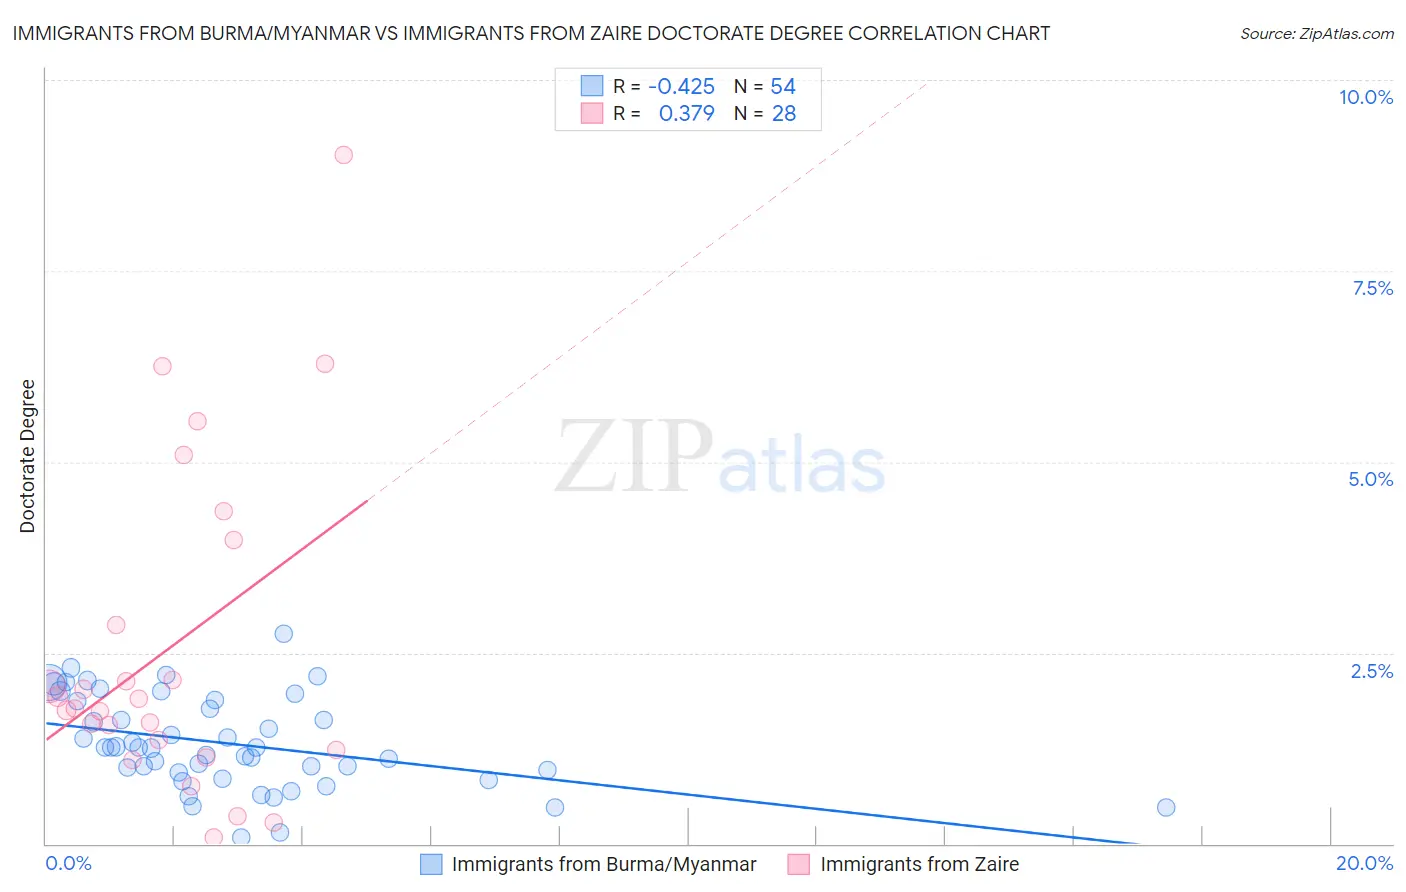
Immigrants from Burma/Myanmar vs Immigrants from Zaire Doctorate Degree Correlation Chart
The statistical analysis conducted on geographies consisting of 171,860,396 people shows a moderate negative correlation between the proportion of Immigrants from Burma/Myanmar and percentage of population with at least doctorate degree education in the United States with a correlation coefficient (R) of -0.425 and weighted average of 1.7%. Similarly, the statistical analysis conducted on geographies consisting of 107,152,130 people shows a mild positive correlation between the proportion of Immigrants from Zaire and percentage of population with at least doctorate degree education in the United States with a correlation coefficient (R) of 0.379 and weighted average of 2.0%, a difference of 16.5%.
Doctorate Degree Correlation Summary
| Measurement | Immigrants from Burma/Myanmar | Immigrants from Zaire |
| Minimum | 0.089% | 0.076% |
| Maximum | 2.7% | 9.0% |
| Range | 2.7% | 8.9% |
| Mean | 1.3% | 2.6% |
| Median | 1.3% | 1.8% |
| Interquartile 25% (IQ1) | 0.93% | 1.3% |
| Interquartile 75% (IQ3) | 1.9% | 3.4% |
| Interquartile Range (IQR) | 0.94% | 2.1% |
| Standard Deviation (Sample) | 0.60% | 2.1% |
| Standard Deviation (Population) | 0.59% | 2.1% |
Similar Demographics by Doctorate Degree
Demographics Similar to Immigrants from Burma/Myanmar by Doctorate Degree
In terms of doctorate degree, the demographic groups most similar to Immigrants from Burma/Myanmar are Alaskan Athabascan (1.7%, a difference of 0.10%), Spanish American (1.7%, a difference of 0.21%), Pueblo (1.7%, a difference of 0.24%), Korean (1.7%, a difference of 0.25%), and Immigrants from South Eastern Asia (1.7%, a difference of 0.39%).
| Demographics | Rating | Rank | Doctorate Degree |
| Immigrants | Western Africa | 15.4 /100 | #209 | Poor 1.7% |
| Tongans | 15.1 /100 | #210 | Poor 1.7% |
| Immigrants | Armenia | 15.1 /100 | #211 | Poor 1.7% |
| Immigrants | South Eastern Asia | 14.7 /100 | #212 | Poor 1.7% |
| Koreans | 14.2 /100 | #213 | Poor 1.7% |
| Pueblo | 14.2 /100 | #214 | Poor 1.7% |
| Alaskan Athabascans | 13.8 /100 | #215 | Poor 1.7% |
| Immigrants | Burma/Myanmar | 13.5 /100 | #216 | Poor 1.7% |
| Spanish Americans | 12.9 /100 | #217 | Poor 1.7% |
| Tlingit-Haida | 11.9 /100 | #218 | Poor 1.7% |
| Immigrants | Iraq | 10.7 /100 | #219 | Poor 1.7% |
| Immigrants | Uruguay | 9.2 /100 | #220 | Tragic 1.7% |
| Immigrants | Nonimmigrants | 8.8 /100 | #221 | Tragic 1.7% |
| Immigrants | Venezuela | 8.7 /100 | #222 | Tragic 1.7% |
| Immigrants | Bosnia and Herzegovina | 7.8 /100 | #223 | Tragic 1.7% |
Demographics Similar to Immigrants from Zaire by Doctorate Degree
In terms of doctorate degree, the demographic groups most similar to Immigrants from Zaire are Canadian (2.0%, a difference of 0.22%), Immigrants from Ukraine (2.0%, a difference of 0.22%), Immigrants from Sierra Leone (2.0%, a difference of 0.36%), Palestinian (2.0%, a difference of 0.42%), and Jordanian (2.0%, a difference of 0.46%).
| Demographics | Rating | Rank | Doctorate Degree |
| Immigrants | Jordan | 94.8 /100 | #121 | Exceptional 2.0% |
| Immigrants | Southern Europe | 94.7 /100 | #122 | Exceptional 2.0% |
| Croatians | 94.0 /100 | #123 | Exceptional 2.0% |
| Ute | 93.2 /100 | #124 | Exceptional 2.0% |
| Moroccans | 93.0 /100 | #125 | Exceptional 2.0% |
| Jordanians | 92.1 /100 | #126 | Exceptional 2.0% |
| Palestinians | 92.0 /100 | #127 | Exceptional 2.0% |
| Immigrants | Zaire | 91.1 /100 | #128 | Exceptional 2.0% |
| Canadians | 90.6 /100 | #129 | Exceptional 2.0% |
| Immigrants | Ukraine | 90.5 /100 | #130 | Exceptional 2.0% |
| Immigrants | Sierra Leone | 90.2 /100 | #131 | Exceptional 2.0% |
| Scottish | 89.4 /100 | #132 | Excellent 2.0% |
| Immigrants | Uzbekistan | 89.3 /100 | #133 | Excellent 2.0% |
| Immigrants | Cameroon | 88.9 /100 | #134 | Excellent 2.0% |
| Serbians | 88.7 /100 | #135 | Excellent 2.0% |