Immigrants from Burma/Myanmar vs Immigrants from Argentina High School Diploma

COMPARE

Immigrants from Burma/Myanmar
Race
Ancestry
AfghanAfricanAlaska NativeAlaskan AthabascanAlbanianAleutAlsatianAmericanApacheArabArapahoArgentineanArmenianAssyrian/Chaldean/SyriacAustralianAustrianBahamianBangladeshiBarbadianBasqueBelgianBelizeanBermudanBhutaneseBlackfeetBolivianBrazilianBritishBritish West IndianBulgarianBurmeseCajunCambodianCanadianCape VerdeanCarpatho RusynCelticCentral AmericanCentral American IndianCherokeeCheyenneChickasawChileanChineseChippewaChoctawColombianColvilleComancheCosta RicanCreeCreekCroatianCrowCubanCypriotCzechCzechoslovakianDanishDelawareDominicanDutchDutch West IndianEastern EuropeanEcuadorianEgyptianEnglishEstonianEthiopianEuropeanFijianFilipinoFinnishFrenchFrench American IndianFrench CanadianGermanGerman RussianGhanaianGreekGuamanian/ChamorroGuatemalanGuyaneseHaitianHmongHonduranHopiHoumaHungarianIcelanderIndian (Asian)IndonesianInupiatIranianIraqiIrishIroquoisIsraeliItalianJamaicanJapaneseJordanianKenyanKiowaKoreanLaotianLatvianLebaneseLiberianLithuanianLumbeeLuxembourgerMacedonianMalaysianMalteseMarshalleseMenomineeMexicanMexican American IndianMongolianMoroccanNative HawaiianNavajoNepaleseNew ZealanderNicaraguanNigerianNorthern EuropeanNorwegianOkinawanOsageOttawaPaiutePakistaniPalestinianPanamanianParaguayanPennsylvania GermanPeruvianPimaPolishPortuguesePotawatomiPuebloPuerto RicanPuget Sound SalishRomanianRussianSalvadoranSamoanScandinavianScotch-IrishScottishSeminoleSenegaleseSerbianShoshoneSierra LeoneanSiouxSlavicSlovakSloveneSomaliSouth AfricanSouth AmericanSouth American IndianSoviet UnionSpaniardSpanishSpanish AmericanSpanish American IndianSri LankanSubsaharan AfricanSudaneseSwedishSwissSyrianTaiwaneseThaiTlingit-HaidaTohono O'OdhamTonganTrinidadian and TobagonianTsimshianTurkishU.S. Virgin IslanderUgandanUkrainianUruguayanUteVenezuelanVietnameseWelshWest IndianYakamaYaquiYugoslavianYumanYup'ikZimbabwean
Immigration
NonimmigrantsImmigrantsAfghanistanAfricaAlbaniaArmeniaAsiaAustraliaAustriaBahamasBangladeshBarbadosBelarusBelgiumBelizeBoliviaBosnia and HerzegovinaBrazilBulgariaBurma/MyanmarCabo VerdeCambodiaCameroonCanadaCaribbeanCentral AmericaChileChinaColombiaCongoCosta RicaCroatiaCubaCzechoslovakiaDenmarkDominicaDominican RepublicEastern AfricaEastern AsiaEastern EuropeEcuadorEgyptEl SalvadorEnglandEritreaEthiopiaEuropeFijiFranceGermanyGhanaGreeceGrenadaGuatemalaGuyanaHaitiHondurasHong KongHungaryIndiaIndonesiaIranIraqIrelandIsraelItalyJamaicaJapanJordanKazakhstanKenyaKoreaKuwaitLaosLatin AmericaLatviaLebanonLiberiaLithuaniaMalaysiaMexicoMicronesiaMiddle AfricaMoldovaMoroccoNepalNetherlandsNicaraguaNigeriaNorth AmericaNorth MacedoniaNorthern AfricaNorthern EuropeNorwayOceaniaPakistanPanamaPeruPhilippinesPolandPortugalRomaniaRussiaSaudi ArabiaScotlandSenegalSerbiaSierra LeoneSingaporeSomaliaSouth AfricaSouth AmericaSouth Central AsiaSouth Eastern AsiaSouthern EuropeSpainSri LankaSt. Vincent and the GrenadinesSudanSwedenSwitzerlandSyriaTaiwanThailandTrinidad and TobagoTurkeyUgandaUkraineUruguayUzbekistanVenezuelaVietnamWest IndiesWestern AfricaWestern AsiaWestern EuropeYemenZaireZimbabweAzores
Immigrants from Argentina
Race
Ancestry
AfghanAfricanAlaska NativeAlaskan AthabascanAlbanianAleutAlsatianAmericanApacheArabArapahoArgentineanArmenianAssyrian/Chaldean/SyriacAustralianAustrianBahamianBangladeshiBarbadianBasqueBelgianBelizeanBermudanBhutaneseBlackfeetBolivianBrazilianBritishBritish West IndianBulgarianBurmeseCajunCambodianCanadianCape VerdeanCarpatho RusynCelticCentral AmericanCentral American IndianCherokeeCheyenneChickasawChileanChineseChippewaChoctawColombianColvilleComancheCosta RicanCreeCreekCroatianCrowCubanCypriotCzechCzechoslovakianDanishDelawareDominicanDutchDutch West IndianEastern EuropeanEcuadorianEgyptianEnglishEstonianEthiopianEuropeanFijianFilipinoFinnishFrenchFrench American IndianFrench CanadianGermanGerman RussianGhanaianGreekGuamanian/ChamorroGuatemalanGuyaneseHaitianHmongHonduranHopiHoumaHungarianIcelanderIndian (Asian)IndonesianInupiatIranianIraqiIrishIroquoisIsraeliItalianJamaicanJapaneseJordanianKenyanKiowaKoreanLaotianLatvianLebaneseLiberianLithuanianLumbeeLuxembourgerMacedonianMalaysianMalteseMarshalleseMenomineeMexicanMexican American IndianMongolianMoroccanNative HawaiianNavajoNepaleseNew ZealanderNicaraguanNigerianNorthern EuropeanNorwegianOkinawanOsageOttawaPaiutePakistaniPalestinianPanamanianParaguayanPennsylvania GermanPeruvianPimaPolishPortuguesePotawatomiPuebloPuerto RicanPuget Sound SalishRomanianRussianSalvadoranSamoanScandinavianScotch-IrishScottishSeminoleSenegaleseSerbianShoshoneSierra LeoneanSiouxSlavicSlovakSloveneSomaliSouth AfricanSouth AmericanSouth American IndianSoviet UnionSpaniardSpanishSpanish AmericanSpanish American IndianSri LankanSubsaharan AfricanSudaneseSwedishSwissSyrianTaiwaneseThaiTlingit-HaidaTohono O'OdhamTonganTrinidadian and TobagonianTsimshianTurkishU.S. Virgin IslanderUgandanUkrainianUruguayanUteVenezuelanVietnameseWelshWest IndianYakamaYaquiYugoslavianYumanYup'ikZimbabwean
Immigration
NonimmigrantsImmigrantsAfghanistanAfricaAlbaniaArgentinaArmeniaAsiaAustraliaAustriaBahamasBangladeshBarbadosBelarusBelgiumBelizeBoliviaBosnia and HerzegovinaBrazilBulgariaCabo VerdeCambodiaCameroonCanadaCaribbeanCentral AmericaChileChinaColombiaCongoCosta RicaCroatiaCubaCzechoslovakiaDenmarkDominicaDominican RepublicEastern AfricaEastern AsiaEastern EuropeEcuadorEgyptEl SalvadorEnglandEritreaEthiopiaEuropeFijiFranceGermanyGhanaGreeceGrenadaGuatemalaGuyanaHaitiHondurasHong KongHungaryIndiaIndonesiaIranIraqIrelandIsraelItalyJamaicaJapanJordanKazakhstanKenyaKoreaKuwaitLaosLatin AmericaLatviaLebanonLiberiaLithuaniaMalaysiaMexicoMicronesiaMiddle AfricaMoldovaMoroccoNepalNetherlandsNicaraguaNigeriaNorth AmericaNorth MacedoniaNorthern AfricaNorthern EuropeNorwayOceaniaPakistanPanamaPeruPhilippinesPolandPortugalRomaniaRussiaSaudi ArabiaScotlandSenegalSerbiaSierra LeoneSingaporeSomaliaSouth AfricaSouth AmericaSouth Central AsiaSouth Eastern AsiaSouthern EuropeSpainSri LankaSt. Vincent and the GrenadinesSudanSwedenSwitzerlandSyriaTaiwanThailandTrinidad and TobagoTurkeyUgandaUkraineUruguayUzbekistanVenezuelaVietnamWest IndiesWestern AfricaWestern AsiaWestern EuropeYemenZaireZimbabweAzores
High School Diploma
Income
Poverty
Unemployment
Labor Participation
Family Structure
Vehicle Availability
Education Level
Disability

High School Diploma Comparison

Immigrants from Burma/Myanmar

Immigrants from Argentina

Tragic
Good
86.7%
HIGH SCHOOL DIPLOMA
0.1/ 100
METRIC RATING
276th/ 347
METRIC RANK
89.4%
HIGH SCHOOL DIPLOMA
65.5/ 100
METRIC RATING
156th/ 347
METRIC RANK

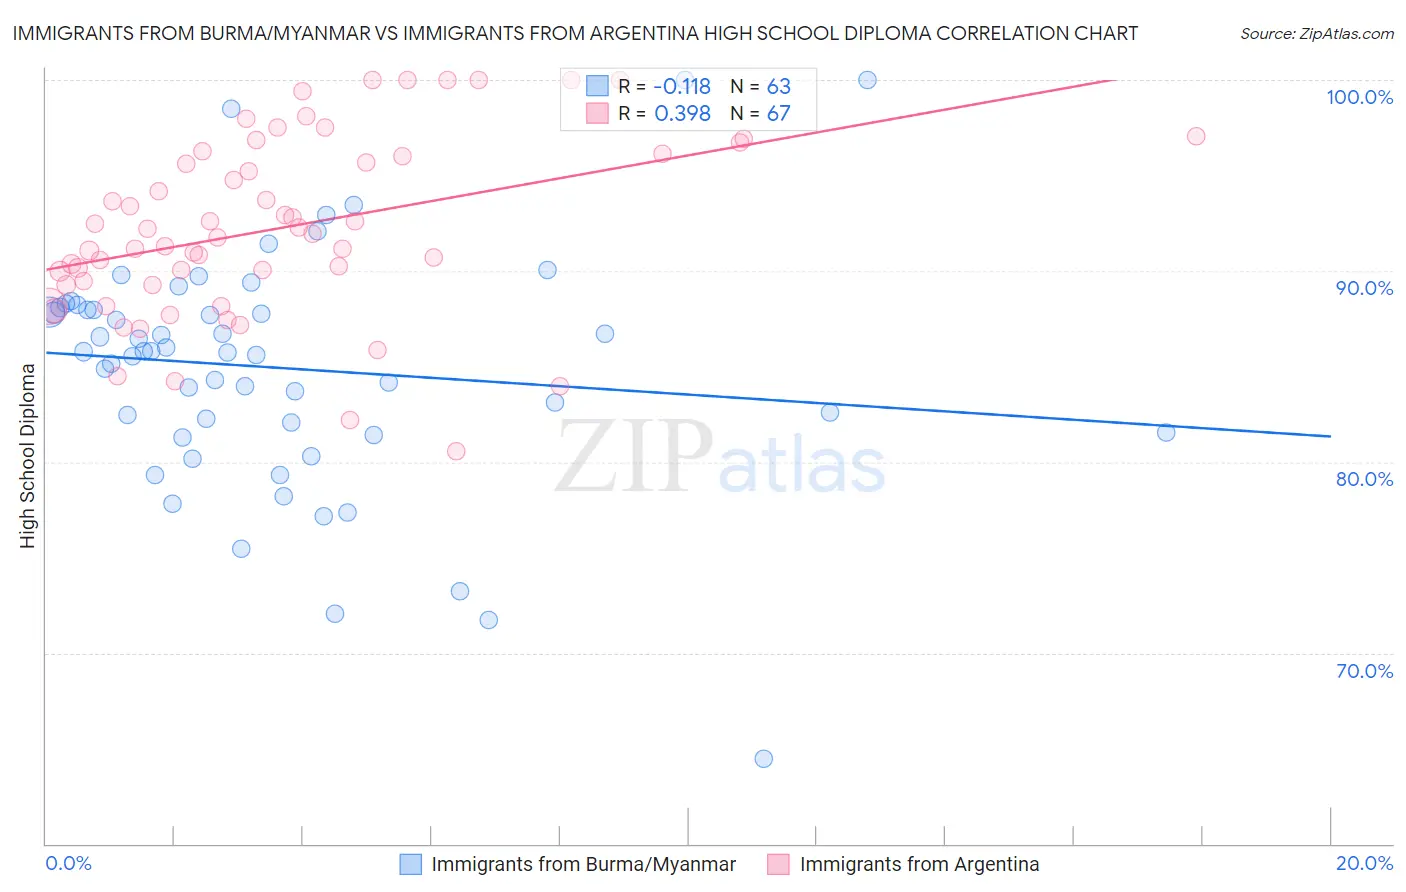
Immigrants from Burma/Myanmar vs Immigrants from Argentina High School Diploma Correlation Chart

The statistical analysis conducted on geographies consisting of 172,345,696 people shows a poor negative correlation between the proportion of Immigrants from Burma/Myanmar and percentage of population with at least high school diploma education in the United States with a correlation coefficient (R) of -0.118 and weighted average of 86.7%. Similarly, the statistical analysis conducted on geographies consisting of 264,434,241 people shows a mild positive correlation between the proportion of Immigrants from Argentina and percentage of population with at least high school diploma education in the United States with a correlation coefficient (R) of 0.398 and weighted average of 89.4%, a difference of 3.1%.
Immigrants from Burma/Myanmar vs Immigrants from Argentina High School Diploma

High School Diploma Correlation Summary

MeasurementImmigrants from Burma/MyanmarImmigrants from Argentina
Minimum64.5%80.6%
Maximum100.0%100.0%
Range35.5%19.4%
Mean84.9%92.2%
Median85.8%91.9%
Interquartile 25% (IQ1)81.5%89.3%
Interquartile 75% (IQ3)88.1%96.1%
Interquartile Range (IQR)6.6%6.8%
Standard Deviation (Sample)6.3%4.7%
Standard Deviation (Population)6.3%4.6%

Similar Demographics by High School Diploma

Demographics Similar to Immigrants from Burma/Myanmar by High School Diploma

In terms of high school diploma, the demographic groups most similar to Immigrants from Burma/Myanmar are Barbadian (86.7%, a difference of 0.010%), Immigrants from Trinidad and Tobago (86.8%, a difference of 0.070%), Hopi (86.6%, a difference of 0.11%), Immigrants from Laos (86.6%, a difference of 0.16%), and Pueblo (86.5%, a difference of 0.18%).
DemographicsRating | RankHigh School Diploma
Sri Lankans
0.2
/100
|
#269
Tragic
87.0%
Malaysians
0.2
/100
|
#270
Tragic
87.0%
West Indians
0.1
/100
|
#271
Tragic
86.9%
Trinidadians and Tobagonians
0.1
/100
|
#272
Tragic
86.9%
Immigrants | Jamaica
0.1
/100
|
#273
Tragic
86.9%
Bangladeshis
0.1
/100
|
#274
Tragic
86.9%
Immigrants | Trinidad and Tobago
0.1
/100
|
#275
Tragic
86.8%
Immigrants | Burma/Myanmar
0.1
/100
|
#276
Tragic
86.7%
Barbadians
0.1
/100
|
#277
Tragic
86.7%
Hopi
0.1
/100
|
#278
Tragic
86.6%
Immigrants | Laos
0.0
/100
|
#279
Tragic
86.6%
Pueblo
0.0
/100
|
#280
Tragic
86.5%
Indonesians
0.0
/100
|
#281
Tragic
86.5%
Dutch West Indians
0.0
/100
|
#282
Tragic
86.5%
Immigrants | Barbados
0.0
/100
|
#283
Tragic
86.4%

Demographics Similar to Immigrants from Argentina by High School Diploma

In terms of high school diploma, the demographic groups most similar to Immigrants from Argentina are Alsatian (89.4%, a difference of 0.020%), Immigrants from Northern Africa (89.4%, a difference of 0.020%), Immigrants from Malaysia (89.3%, a difference of 0.030%), Immigrants from Iraq (89.4%, a difference of 0.050%), and Immigrants from Pakistan (89.3%, a difference of 0.050%).
DemographicsRating | RankHigh School Diploma
Immigrants | Poland
72.9
/100
|
#149
Good
89.5%
Argentineans
72.3
/100
|
#150
Good
89.5%
Paraguayans
71.4
/100
|
#151
Good
89.5%
Asians
70.7
/100
|
#152
Good
89.4%
Immigrants | Iraq
68.7
/100
|
#153
Good
89.4%
Alsatians
66.8
/100
|
#154
Good
89.4%
Immigrants | Northern Africa
66.4
/100
|
#155
Good
89.4%
Immigrants | Argentina
65.5
/100
|
#156
Good
89.4%
Immigrants | Malaysia
63.5
/100
|
#157
Good
89.3%
Immigrants | Pakistan
62.5
/100
|
#158
Good
89.3%
Immigrants | China
62.0
/100
|
#159
Good
89.3%
Laotians
61.8
/100
|
#160
Good
89.3%
Brazilians
61.2
/100
|
#161
Good
89.3%
Bermudans
61.1
/100
|
#162
Good
89.3%
Cree
61.1
/100
|
#163
Good
89.3%