Immigrants from Burma/Myanmar vs Immigrants from Moldova High School Diploma
COMPARE
Immigrants from Burma/Myanmar
Immigrants from Moldova
High School Diploma
High School Diploma Comparison
Immigrants from Burma/Myanmar
Immigrants from Moldova
86.7%
HIGH SCHOOL DIPLOMA
0.1/ 100
METRIC RATING
276th/ 347
METRIC RANK
90.7%
HIGH SCHOOL DIPLOMA
99.2/ 100
METRIC RATING
83rd/ 347
METRIC RANK
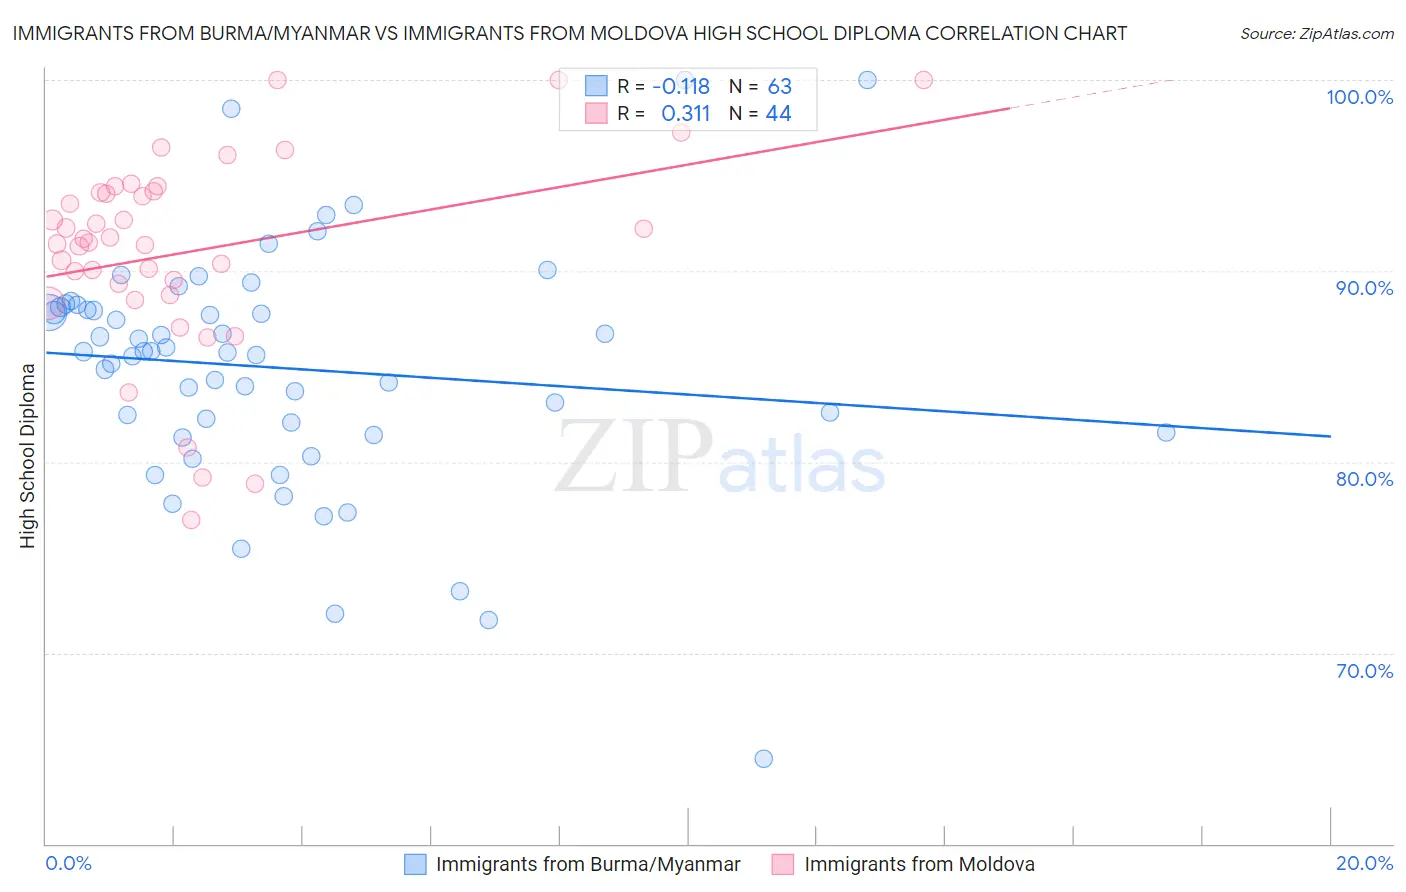
Immigrants from Burma/Myanmar vs Immigrants from Moldova High School Diploma Correlation Chart
The statistical analysis conducted on geographies consisting of 172,345,696 people shows a poor negative correlation between the proportion of Immigrants from Burma/Myanmar and percentage of population with at least high school diploma education in the United States with a correlation coefficient (R) of -0.118 and weighted average of 86.7%. Similarly, the statistical analysis conducted on geographies consisting of 124,401,069 people shows a mild positive correlation between the proportion of Immigrants from Moldova and percentage of population with at least high school diploma education in the United States with a correlation coefficient (R) of 0.311 and weighted average of 90.7%, a difference of 4.7%.
High School Diploma Correlation Summary
| Measurement | Immigrants from Burma/Myanmar | Immigrants from Moldova |
| Minimum | 64.5% | 77.0% |
| Maximum | 100.0% | 100.0% |
| Range | 35.5% | 23.0% |
| Mean | 84.9% | 91.0% |
| Median | 85.8% | 91.6% |
| Interquartile 25% (IQ1) | 81.5% | 89.0% |
| Interquartile 75% (IQ3) | 88.1% | 94.2% |
| Interquartile Range (IQR) | 6.6% | 5.1% |
| Standard Deviation (Sample) | 6.3% | 5.3% |
| Standard Deviation (Population) | 6.3% | 5.2% |
Similar Demographics by High School Diploma
Demographics Similar to Immigrants from Burma/Myanmar by High School Diploma
In terms of high school diploma, the demographic groups most similar to Immigrants from Burma/Myanmar are Barbadian (86.7%, a difference of 0.010%), Immigrants from Trinidad and Tobago (86.8%, a difference of 0.070%), Hopi (86.6%, a difference of 0.11%), Immigrants from Laos (86.6%, a difference of 0.16%), and Pueblo (86.5%, a difference of 0.18%).
| Demographics | Rating | Rank | High School Diploma |
| Sri Lankans | 0.2 /100 | #269 | Tragic 87.0% |
| Malaysians | 0.2 /100 | #270 | Tragic 87.0% |
| West Indians | 0.1 /100 | #271 | Tragic 86.9% |
| Trinidadians and Tobagonians | 0.1 /100 | #272 | Tragic 86.9% |
| Immigrants | Jamaica | 0.1 /100 | #273 | Tragic 86.9% |
| Bangladeshis | 0.1 /100 | #274 | Tragic 86.9% |
| Immigrants | Trinidad and Tobago | 0.1 /100 | #275 | Tragic 86.8% |
| Immigrants | Burma/Myanmar | 0.1 /100 | #276 | Tragic 86.7% |
| Barbadians | 0.1 /100 | #277 | Tragic 86.7% |
| Hopi | 0.1 /100 | #278 | Tragic 86.6% |
| Immigrants | Laos | 0.0 /100 | #279 | Tragic 86.6% |
| Pueblo | 0.0 /100 | #280 | Tragic 86.5% |
| Indonesians | 0.0 /100 | #281 | Tragic 86.5% |
| Dutch West Indians | 0.0 /100 | #282 | Tragic 86.5% |
| Immigrants | Barbados | 0.0 /100 | #283 | Tragic 86.4% |
Demographics Similar to Immigrants from Moldova by High School Diploma
In terms of high school diploma, the demographic groups most similar to Immigrants from Moldova are Scotch-Irish (90.8%, a difference of 0.020%), Immigrants from Saudi Arabia (90.7%, a difference of 0.030%), Immigrants from Switzerland (90.8%, a difference of 0.050%), Immigrants from England (90.8%, a difference of 0.060%), and Immigrants from Denmark (90.8%, a difference of 0.070%).
| Demographics | Rating | Rank | High School Diploma |
| Hungarians | 99.3 /100 | #76 | Exceptional 90.8% |
| Native Hawaiians | 99.3 /100 | #77 | Exceptional 90.8% |
| Burmese | 99.3 /100 | #78 | Exceptional 90.8% |
| Immigrants | Denmark | 99.3 /100 | #79 | Exceptional 90.8% |
| Immigrants | England | 99.3 /100 | #80 | Exceptional 90.8% |
| Immigrants | Switzerland | 99.3 /100 | #81 | Exceptional 90.8% |
| Scotch-Irish | 99.2 /100 | #82 | Exceptional 90.8% |
| Immigrants | Moldova | 99.2 /100 | #83 | Exceptional 90.7% |
| Immigrants | Saudi Arabia | 99.1 /100 | #84 | Exceptional 90.7% |
| Romanians | 98.9 /100 | #85 | Exceptional 90.7% |
| Immigrants | Bulgaria | 98.9 /100 | #86 | Exceptional 90.6% |
| Immigrants | Turkey | 98.9 /100 | #87 | Exceptional 90.6% |
| Immigrants | France | 98.8 /100 | #88 | Exceptional 90.6% |
| Canadians | 98.7 /100 | #89 | Exceptional 90.6% |
| Celtics | 98.7 /100 | #90 | Exceptional 90.6% |