Peruvian vs Immigrants from Zaire High School Diploma
COMPARE
Peruvian
Immigrants from Zaire
High School Diploma
High School Diploma Comparison
Peruvians
Immigrants from Zaire
87.8%
HIGH SCHOOL DIPLOMA
1.9/ 100
METRIC RATING
245th/ 347
METRIC RANK
88.3%
HIGH SCHOOL DIPLOMA
7.6/ 100
METRIC RATING
223rd/ 347
METRIC RANK
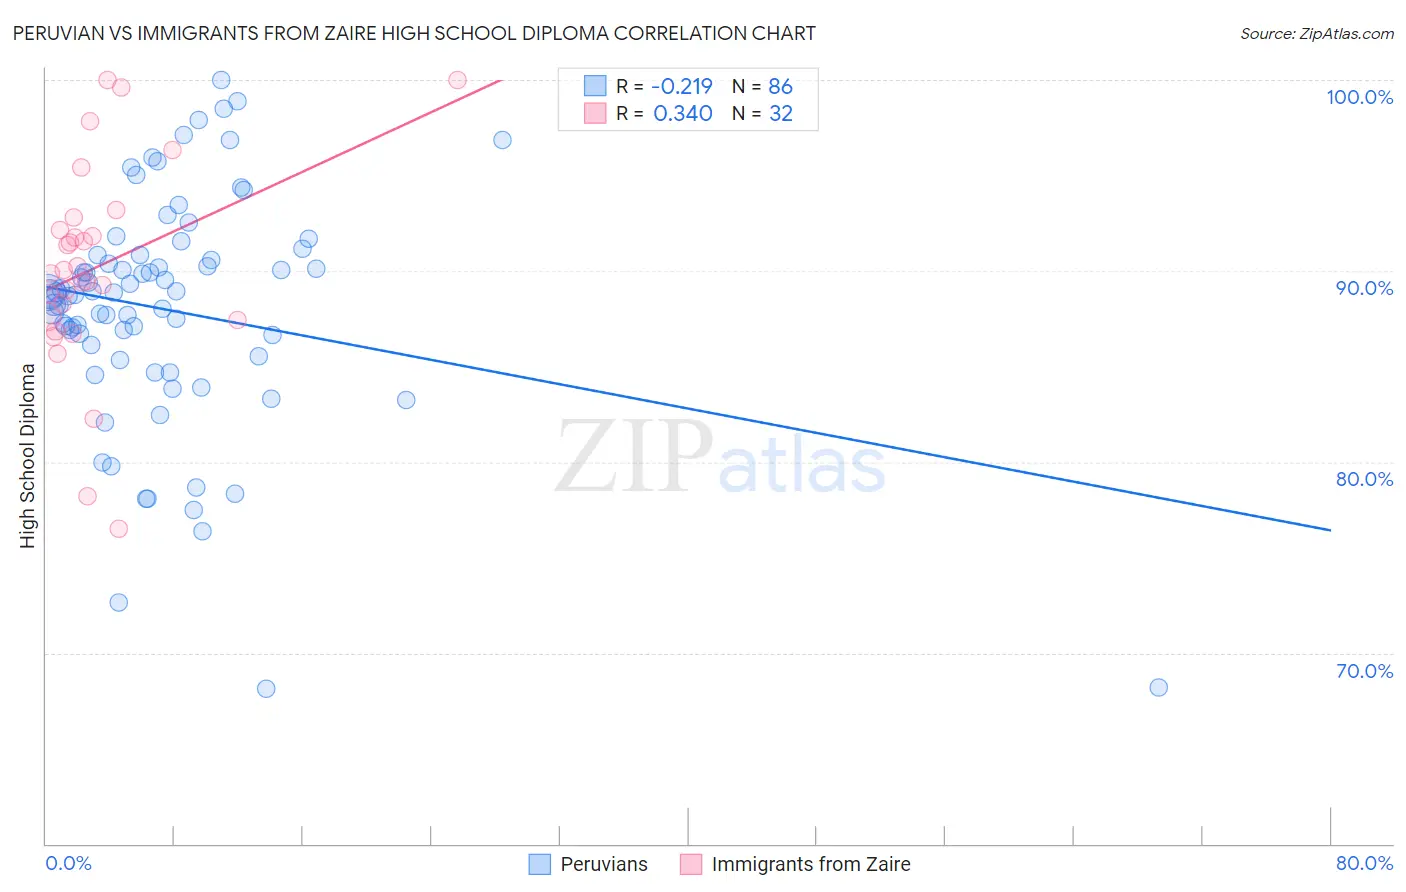
Peruvian vs Immigrants from Zaire High School Diploma Correlation Chart
The statistical analysis conducted on geographies consisting of 363,251,075 people shows a weak negative correlation between the proportion of Peruvians and percentage of population with at least high school diploma education in the United States with a correlation coefficient (R) of -0.219 and weighted average of 87.8%. Similarly, the statistical analysis conducted on geographies consisting of 107,255,805 people shows a mild positive correlation between the proportion of Immigrants from Zaire and percentage of population with at least high school diploma education in the United States with a correlation coefficient (R) of 0.340 and weighted average of 88.3%, a difference of 0.56%.
High School Diploma Correlation Summary
| Measurement | Peruvian | Immigrants from Zaire |
| Minimum | 68.1% | 76.5% |
| Maximum | 100.0% | 100.0% |
| Range | 31.9% | 23.5% |
| Mean | 87.9% | 90.2% |
| Median | 88.8% | 90.0% |
| Interquartile 25% (IQ1) | 85.5% | 87.5% |
| Interquartile 75% (IQ3) | 90.8% | 92.5% |
| Interquartile Range (IQR) | 5.3% | 5.0% |
| Standard Deviation (Sample) | 6.1% | 5.4% |
| Standard Deviation (Population) | 6.1% | 5.3% |
Similar Demographics by High School Diploma
Demographics Similar to Peruvians by High School Diploma
In terms of high school diploma, the demographic groups most similar to Peruvians are Immigrants from Philippines (87.8%, a difference of 0.010%), Choctaw (87.8%, a difference of 0.010%), Immigrants from Eritrea (87.8%, a difference of 0.030%), Immigrants from Uzbekistan (87.8%, a difference of 0.040%), and Cheyenne (87.8%, a difference of 0.040%).
| Demographics | Rating | Rank | High School Diploma |
| Sioux | 2.7 /100 | #238 | Tragic 87.9% |
| South Americans | 2.7 /100 | #239 | Tragic 87.9% |
| Comanche | 2.2 /100 | #240 | Tragic 87.9% |
| Immigrants | Uzbekistan | 2.1 /100 | #241 | Tragic 87.8% |
| Cheyenne | 2.1 /100 | #242 | Tragic 87.8% |
| Immigrants | Philippines | 1.9 /100 | #243 | Tragic 87.8% |
| Choctaw | 1.9 /100 | #244 | Tragic 87.8% |
| Peruvians | 1.9 /100 | #245 | Tragic 87.8% |
| Immigrants | Eritrea | 1.7 /100 | #246 | Tragic 87.8% |
| Immigrants | Costa Rica | 1.7 /100 | #247 | Tragic 87.8% |
| Spanish Americans | 1.5 /100 | #248 | Tragic 87.7% |
| Senegalese | 1.5 /100 | #249 | Tragic 87.7% |
| Immigrants | Nigeria | 1.5 /100 | #250 | Tragic 87.7% |
| Ghanaians | 1.4 /100 | #251 | Tragic 87.7% |
| Immigrants | South America | 1.2 /100 | #252 | Tragic 87.6% |
Demographics Similar to Immigrants from Zaire by High School Diploma
In terms of high school diploma, the demographic groups most similar to Immigrants from Zaire are Colville (88.3%, a difference of 0.010%), Shoshone (88.3%, a difference of 0.040%), Creek (88.3%, a difference of 0.040%), Immigrants from Afghanistan (88.3%, a difference of 0.050%), and Tongan (88.4%, a difference of 0.090%).
| Demographics | Rating | Rank | High School Diploma |
| Chickasaw | 10.7 /100 | #216 | Poor 88.4% |
| Immigrants | Africa | 10.6 /100 | #217 | Poor 88.4% |
| Immigrants | Bolivia | 10.3 /100 | #218 | Poor 88.4% |
| Costa Ricans | 9.6 /100 | #219 | Tragic 88.4% |
| Tongans | 9.5 /100 | #220 | Tragic 88.4% |
| Immigrants | Afghanistan | 8.6 /100 | #221 | Tragic 88.3% |
| Colville | 7.8 /100 | #222 | Tragic 88.3% |
| Immigrants | Zaire | 7.6 /100 | #223 | Tragic 88.3% |
| Shoshone | 7.0 /100 | #224 | Tragic 88.3% |
| Creek | 6.9 /100 | #225 | Tragic 88.3% |
| Uruguayans | 5.6 /100 | #226 | Tragic 88.2% |
| Immigrants | Liberia | 5.5 /100 | #227 | Tragic 88.2% |
| Kiowa | 5.3 /100 | #228 | Tragic 88.2% |
| Nigerians | 5.2 /100 | #229 | Tragic 88.2% |
| Blackfeet | 4.2 /100 | #230 | Tragic 88.1% |