Immigrants from Burma/Myanmar vs Comanche High School Diploma
COMPARE
Immigrants from Burma/Myanmar
Comanche
High School Diploma
High School Diploma Comparison
Immigrants from Burma/Myanmar
Comanche
86.7%
HIGH SCHOOL DIPLOMA
0.1/ 100
METRIC RATING
276th/ 347
METRIC RANK
87.9%
HIGH SCHOOL DIPLOMA
2.2/ 100
METRIC RATING
240th/ 347
METRIC RANK
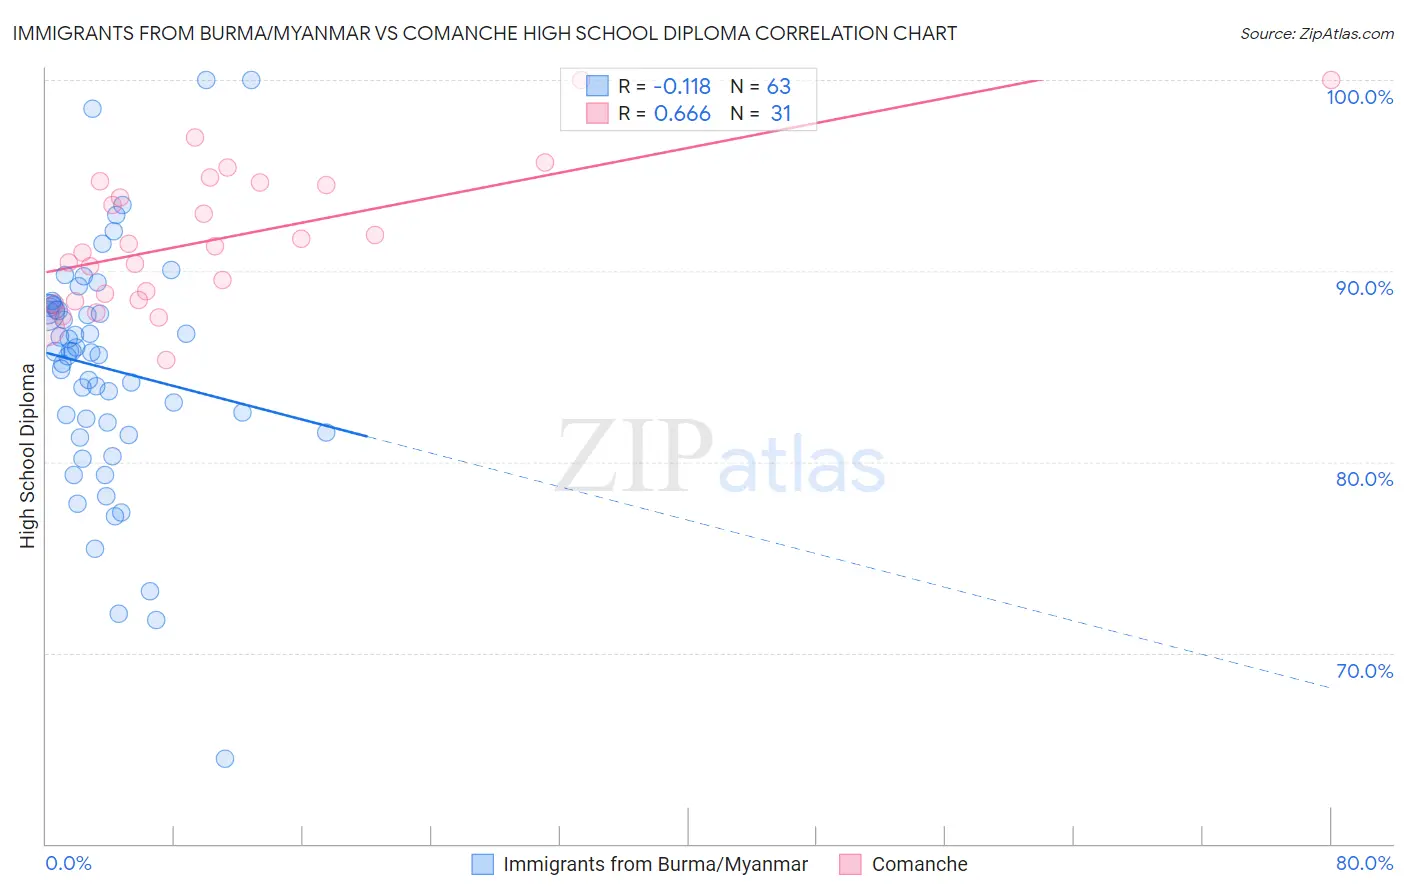
Immigrants from Burma/Myanmar vs Comanche High School Diploma Correlation Chart
The statistical analysis conducted on geographies consisting of 172,345,696 people shows a poor negative correlation between the proportion of Immigrants from Burma/Myanmar and percentage of population with at least high school diploma education in the United States with a correlation coefficient (R) of -0.118 and weighted average of 86.7%. Similarly, the statistical analysis conducted on geographies consisting of 109,786,530 people shows a significant positive correlation between the proportion of Comanche and percentage of population with at least high school diploma education in the United States with a correlation coefficient (R) of 0.666 and weighted average of 87.9%, a difference of 1.4%.
High School Diploma Correlation Summary
| Measurement | Immigrants from Burma/Myanmar | Comanche |
| Minimum | 64.5% | 85.3% |
| Maximum | 100.0% | 100.0% |
| Range | 35.5% | 14.7% |
| Mean | 84.9% | 91.7% |
| Median | 85.8% | 91.3% |
| Interquartile 25% (IQ1) | 81.5% | 88.5% |
| Interquartile 75% (IQ3) | 88.1% | 94.6% |
| Interquartile Range (IQR) | 6.6% | 6.2% |
| Standard Deviation (Sample) | 6.3% | 3.7% |
| Standard Deviation (Population) | 6.3% | 3.6% |
Similar Demographics by High School Diploma
Demographics Similar to Immigrants from Burma/Myanmar by High School Diploma
In terms of high school diploma, the demographic groups most similar to Immigrants from Burma/Myanmar are Barbadian (86.7%, a difference of 0.010%), Immigrants from Trinidad and Tobago (86.8%, a difference of 0.070%), Hopi (86.6%, a difference of 0.11%), Immigrants from Laos (86.6%, a difference of 0.16%), and Pueblo (86.5%, a difference of 0.18%).
| Demographics | Rating | Rank | High School Diploma |
| Sri Lankans | 0.2 /100 | #269 | Tragic 87.0% |
| Malaysians | 0.2 /100 | #270 | Tragic 87.0% |
| West Indians | 0.1 /100 | #271 | Tragic 86.9% |
| Trinidadians and Tobagonians | 0.1 /100 | #272 | Tragic 86.9% |
| Immigrants | Jamaica | 0.1 /100 | #273 | Tragic 86.9% |
| Bangladeshis | 0.1 /100 | #274 | Tragic 86.9% |
| Immigrants | Trinidad and Tobago | 0.1 /100 | #275 | Tragic 86.8% |
| Immigrants | Burma/Myanmar | 0.1 /100 | #276 | Tragic 86.7% |
| Barbadians | 0.1 /100 | #277 | Tragic 86.7% |
| Hopi | 0.1 /100 | #278 | Tragic 86.6% |
| Immigrants | Laos | 0.0 /100 | #279 | Tragic 86.6% |
| Pueblo | 0.0 /100 | #280 | Tragic 86.5% |
| Indonesians | 0.0 /100 | #281 | Tragic 86.5% |
| Dutch West Indians | 0.0 /100 | #282 | Tragic 86.5% |
| Immigrants | Barbados | 0.0 /100 | #283 | Tragic 86.4% |
Demographics Similar to Comanche by High School Diploma
In terms of high school diploma, the demographic groups most similar to Comanche are Immigrants from Uzbekistan (87.8%, a difference of 0.030%), Cheyenne (87.8%, a difference of 0.030%), Immigrants from Philippines (87.8%, a difference of 0.050%), Choctaw (87.8%, a difference of 0.060%), and Peruvian (87.8%, a difference of 0.070%).
| Demographics | Rating | Rank | High School Diploma |
| Immigrants | Panama | 3.1 /100 | #233 | Tragic 88.0% |
| Immigrants | Thailand | 3.1 /100 | #234 | Tragic 88.0% |
| Immigrants | Bahamas | 2.9 /100 | #235 | Tragic 88.0% |
| Sub-Saharan Africans | 2.8 /100 | #236 | Tragic 87.9% |
| Taiwanese | 2.8 /100 | #237 | Tragic 87.9% |
| Sioux | 2.7 /100 | #238 | Tragic 87.9% |
| South Americans | 2.7 /100 | #239 | Tragic 87.9% |
| Comanche | 2.2 /100 | #240 | Tragic 87.9% |
| Immigrants | Uzbekistan | 2.1 /100 | #241 | Tragic 87.8% |
| Cheyenne | 2.1 /100 | #242 | Tragic 87.8% |
| Immigrants | Philippines | 1.9 /100 | #243 | Tragic 87.8% |
| Choctaw | 1.9 /100 | #244 | Tragic 87.8% |
| Peruvians | 1.9 /100 | #245 | Tragic 87.8% |
| Immigrants | Eritrea | 1.7 /100 | #246 | Tragic 87.8% |
| Immigrants | Costa Rica | 1.7 /100 | #247 | Tragic 87.8% |