Immigrants from Belgium vs Immigrants from Latin America GED/Equivalency
COMPARE
Immigrants from Belgium
Immigrants from Latin America
GED/Equivalency
GED/Equivalency Comparison
Immigrants from Belgium
Immigrants from Latin America
88.3%
GED/EQUIVALENCY
99.7/ 100
METRIC RATING
36th/ 347
METRIC RANK
78.5%
GED/EQUIVALENCY
0.0/ 100
METRIC RATING
335th/ 347
METRIC RANK
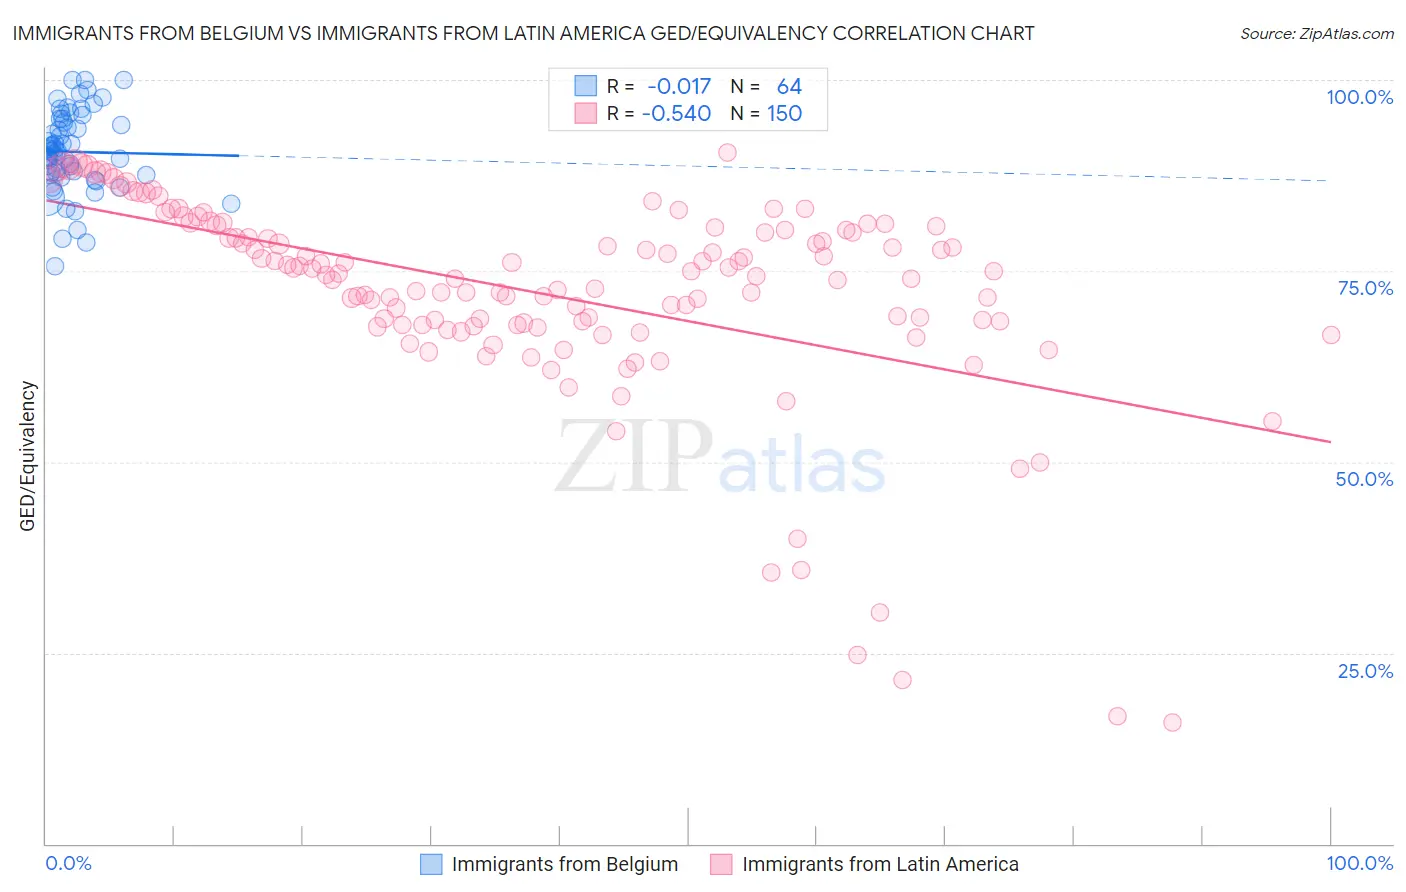
Immigrants from Belgium vs Immigrants from Latin America GED/Equivalency Correlation Chart
The statistical analysis conducted on geographies consisting of 146,727,159 people shows no correlation between the proportion of Immigrants from Belgium and percentage of population with at least ged/equivalency education in the United States with a correlation coefficient (R) of -0.017 and weighted average of 88.3%. Similarly, the statistical analysis conducted on geographies consisting of 558,649,843 people shows a substantial negative correlation between the proportion of Immigrants from Latin America and percentage of population with at least ged/equivalency education in the United States with a correlation coefficient (R) of -0.540 and weighted average of 78.5%, a difference of 12.6%.
GED/Equivalency Correlation Summary
| Measurement | Immigrants from Belgium | Immigrants from Latin America |
| Minimum | 75.5% | 16.0% |
| Maximum | 100.0% | 90.5% |
| Range | 24.5% | 74.6% |
| Mean | 90.6% | 72.1% |
| Median | 90.6% | 74.6% |
| Interquartile 25% (IQ1) | 87.5% | 68.0% |
| Interquartile 75% (IQ3) | 94.6% | 80.4% |
| Interquartile Range (IQR) | 7.1% | 12.4% |
| Standard Deviation (Sample) | 5.4% | 13.6% |
| Standard Deviation (Population) | 5.3% | 13.5% |
Similar Demographics by GED/Equivalency
Demographics Similar to Immigrants from Belgium by GED/Equivalency
In terms of ged/equivalency, the demographic groups most similar to Immigrants from Belgium are Immigrants from South Central Asia (88.4%, a difference of 0.020%), Immigrants from Austria (88.3%, a difference of 0.030%), Immigrants from Japan (88.4%, a difference of 0.040%), Immigrants from Sweden (88.4%, a difference of 0.050%), and Burmese (88.3%, a difference of 0.060%).
| Demographics | Rating | Rank | GED/Equivalency |
| Poles | 99.8 /100 | #29 | Exceptional 88.5% |
| Turks | 99.8 /100 | #30 | Exceptional 88.5% |
| Bhutanese | 99.8 /100 | #31 | Exceptional 88.4% |
| Danes | 99.8 /100 | #32 | Exceptional 88.4% |
| Immigrants | Sweden | 99.7 /100 | #33 | Exceptional 88.4% |
| Immigrants | Japan | 99.7 /100 | #34 | Exceptional 88.4% |
| Immigrants | South Central Asia | 99.7 /100 | #35 | Exceptional 88.4% |
| Immigrants | Belgium | 99.7 /100 | #36 | Exceptional 88.3% |
| Immigrants | Austria | 99.7 /100 | #37 | Exceptional 88.3% |
| Burmese | 99.7 /100 | #38 | Exceptional 88.3% |
| Immigrants | Israel | 99.6 /100 | #39 | Exceptional 88.2% |
| Italians | 99.6 /100 | #40 | Exceptional 88.2% |
| Finns | 99.6 /100 | #41 | Exceptional 88.2% |
| Cambodians | 99.6 /100 | #42 | Exceptional 88.2% |
| Immigrants | Scotland | 99.6 /100 | #43 | Exceptional 88.2% |
Demographics Similar to Immigrants from Latin America by GED/Equivalency
In terms of ged/equivalency, the demographic groups most similar to Immigrants from Latin America are Guatemalan (78.5%, a difference of 0.020%), Salvadoran (78.6%, a difference of 0.11%), Immigrants from the Azores (78.7%, a difference of 0.22%), Immigrants from Honduras (78.7%, a difference of 0.33%), and Immigrants from Cabo Verde (78.9%, a difference of 0.58%).
| Demographics | Rating | Rank | GED/Equivalency |
| Hispanics or Latinos | 0.0 /100 | #328 | Tragic 79.1% |
| Dominicans | 0.0 /100 | #329 | Tragic 79.1% |
| Immigrants | Cabo Verde | 0.0 /100 | #330 | Tragic 78.9% |
| Immigrants | Honduras | 0.0 /100 | #331 | Tragic 78.7% |
| Immigrants | Azores | 0.0 /100 | #332 | Tragic 78.7% |
| Salvadorans | 0.0 /100 | #333 | Tragic 78.6% |
| Guatemalans | 0.0 /100 | #334 | Tragic 78.5% |
| Immigrants | Latin America | 0.0 /100 | #335 | Tragic 78.5% |
| Immigrants | Dominican Republic | 0.0 /100 | #336 | Tragic 78.0% |
| Immigrants | Yemen | 0.0 /100 | #337 | Tragic 77.9% |
| Immigrants | Guatemala | 0.0 /100 | #338 | Tragic 77.9% |
| Immigrants | El Salvador | 0.0 /100 | #339 | Tragic 77.6% |
| Tohono O'odham | 0.0 /100 | #340 | Tragic 77.5% |
| Mexicans | 0.0 /100 | #341 | Tragic 77.4% |
| Pima | 0.0 /100 | #342 | Tragic 76.4% |