Immigrants from Belgium vs Cheyenne Disability Age 35 to 64
COMPARE
Immigrants from Belgium
Cheyenne
Disability Age 35 to 64
Disability Age 35 to 64 Comparison
Immigrants from Belgium
Cheyenne
9.8%
DISABILITY AGE 35 TO 64
99.8/ 100
METRIC RATING
47th/ 347
METRIC RANK
13.6%
DISABILITY AGE 35 TO 64
0.0/ 100
METRIC RATING
298th/ 347
METRIC RANK
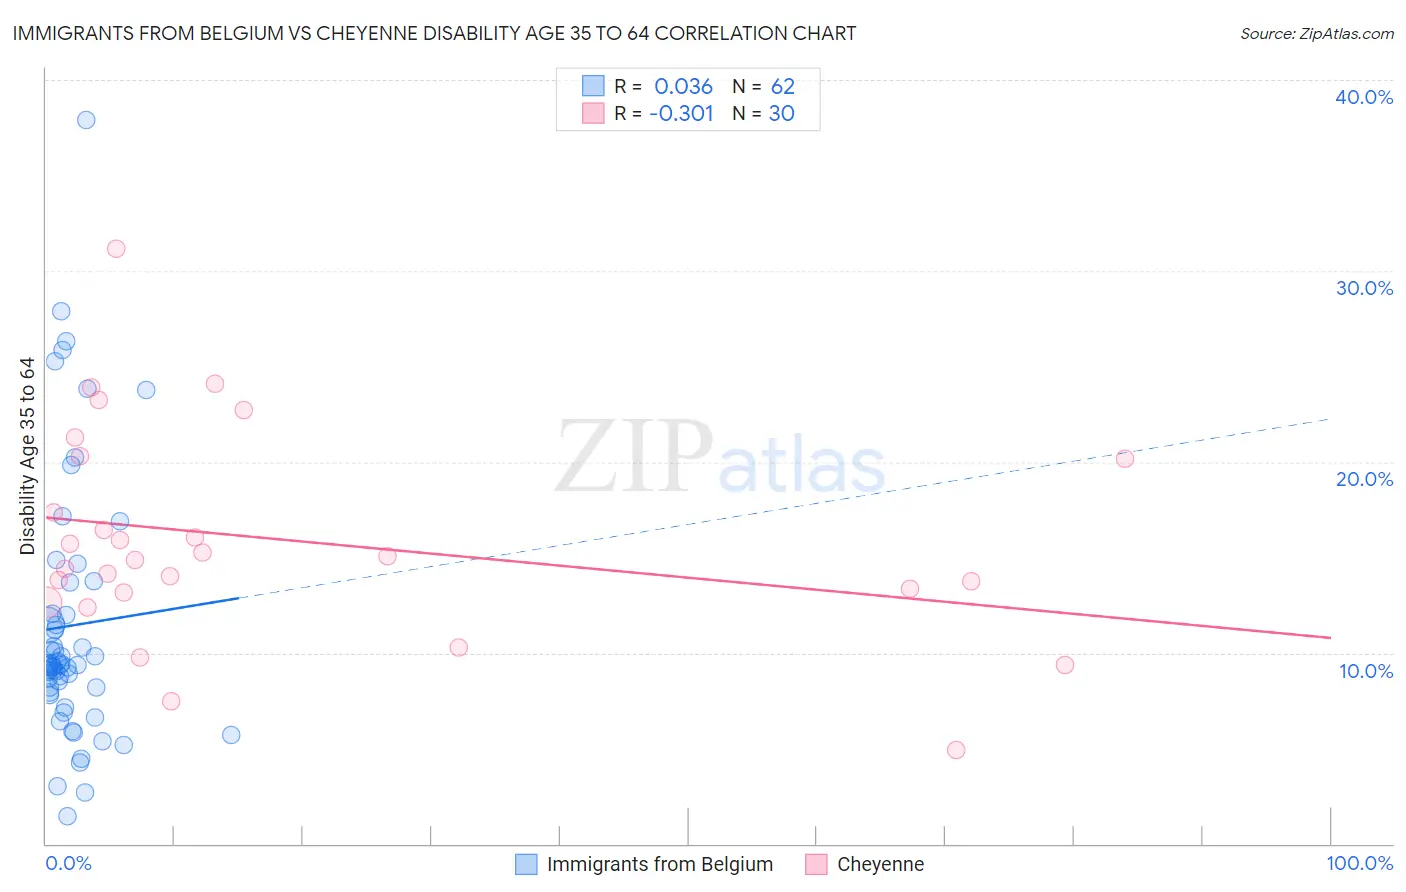
Immigrants from Belgium vs Cheyenne Disability Age 35 to 64 Correlation Chart
The statistical analysis conducted on geographies consisting of 146,696,075 people shows no correlation between the proportion of Immigrants from Belgium and percentage of population with a disability between the ages 34 and 64 in the United States with a correlation coefficient (R) of 0.036 and weighted average of 9.8%. Similarly, the statistical analysis conducted on geographies consisting of 80,703,437 people shows a mild negative correlation between the proportion of Cheyenne and percentage of population with a disability between the ages 34 and 64 in the United States with a correlation coefficient (R) of -0.301 and weighted average of 13.6%, a difference of 38.9%.
Disability Age 35 to 64 Correlation Summary
| Measurement | Immigrants from Belgium | Cheyenne |
| Minimum | 1.4% | 4.9% |
| Maximum | 37.9% | 31.1% |
| Range | 36.5% | 26.3% |
| Mean | 11.4% | 15.9% |
| Median | 9.3% | 15.0% |
| Interquartile 25% (IQ1) | 7.9% | 13.1% |
| Interquartile 75% (IQ3) | 12.0% | 20.2% |
| Interquartile Range (IQR) | 4.1% | 7.0% |
| Standard Deviation (Sample) | 6.9% | 5.6% |
| Standard Deviation (Population) | 6.8% | 5.5% |
Similar Demographics by Disability Age 35 to 64
Demographics Similar to Immigrants from Belgium by Disability Age 35 to 64
In terms of disability age 35 to 64, the demographic groups most similar to Immigrants from Belgium are Immigrants from Serbia (9.8%, a difference of 0.010%), Cambodian (9.8%, a difference of 0.050%), Immigrants from Greece (9.8%, a difference of 0.050%), Paraguayan (9.8%, a difference of 0.12%), and Bhutanese (9.8%, a difference of 0.21%).
| Demographics | Rating | Rank | Disability Age 35 to 64 |
| Immigrants | Armenia | 99.9 /100 | #40 | Exceptional 9.7% |
| Israelis | 99.9 /100 | #41 | Exceptional 9.7% |
| Immigrants | Malaysia | 99.9 /100 | #42 | Exceptional 9.7% |
| Immigrants | Colombia | 99.9 /100 | #43 | Exceptional 9.8% |
| Immigrants | Egypt | 99.9 /100 | #44 | Exceptional 9.8% |
| Immigrants | Peru | 99.9 /100 | #45 | Exceptional 9.8% |
| Cambodians | 99.8 /100 | #46 | Exceptional 9.8% |
| Immigrants | Belgium | 99.8 /100 | #47 | Exceptional 9.8% |
| Immigrants | Serbia | 99.8 /100 | #48 | Exceptional 9.8% |
| Immigrants | Greece | 99.8 /100 | #49 | Exceptional 9.8% |
| Paraguayans | 99.8 /100 | #50 | Exceptional 9.8% |
| Bhutanese | 99.8 /100 | #51 | Exceptional 9.8% |
| Immigrants | Bulgaria | 99.8 /100 | #52 | Exceptional 9.8% |
| Taiwanese | 99.8 /100 | #53 | Exceptional 9.8% |
| Immigrants | Russia | 99.8 /100 | #54 | Exceptional 9.8% |
Demographics Similar to Cheyenne by Disability Age 35 to 64
In terms of disability age 35 to 64, the demographic groups most similar to Cheyenne are Bangladeshi (13.6%, a difference of 0.030%), Spanish American (13.7%, a difference of 0.20%), Delaware (13.7%, a difference of 0.28%), African (13.6%, a difference of 0.38%), and French American Indian (13.7%, a difference of 0.58%).
| Demographics | Rating | Rank | Disability Age 35 to 64 |
| Immigrants | Congo | 0.0 /100 | #291 | Tragic 13.3% |
| Puget Sound Salish | 0.0 /100 | #292 | Tragic 13.3% |
| Ute | 0.0 /100 | #293 | Tragic 13.4% |
| Yaqui | 0.0 /100 | #294 | Tragic 13.5% |
| Yakama | 0.0 /100 | #295 | Tragic 13.6% |
| Africans | 0.0 /100 | #296 | Tragic 13.6% |
| Bangladeshis | 0.0 /100 | #297 | Tragic 13.6% |
| Cheyenne | 0.0 /100 | #298 | Tragic 13.6% |
| Spanish Americans | 0.0 /100 | #299 | Tragic 13.7% |
| Delaware | 0.0 /100 | #300 | Tragic 13.7% |
| French American Indians | 0.0 /100 | #301 | Tragic 13.7% |
| Aleuts | 0.0 /100 | #302 | Tragic 13.8% |
| Sioux | 0.0 /100 | #303 | Tragic 13.9% |
| Hopi | 0.0 /100 | #304 | Tragic 13.9% |
| Americans | 0.0 /100 | #305 | Tragic 13.9% |