Immigrants from Belgium vs Zimbabwean GED/Equivalency
COMPARE
Immigrants from Belgium
Zimbabwean
GED/Equivalency
GED/Equivalency Comparison
Immigrants from Belgium
Zimbabweans
88.3%
GED/EQUIVALENCY
99.7/ 100
METRIC RATING
36th/ 347
METRIC RANK
88.0%
GED/EQUIVALENCY
99.4/ 100
METRIC RATING
52nd/ 347
METRIC RANK
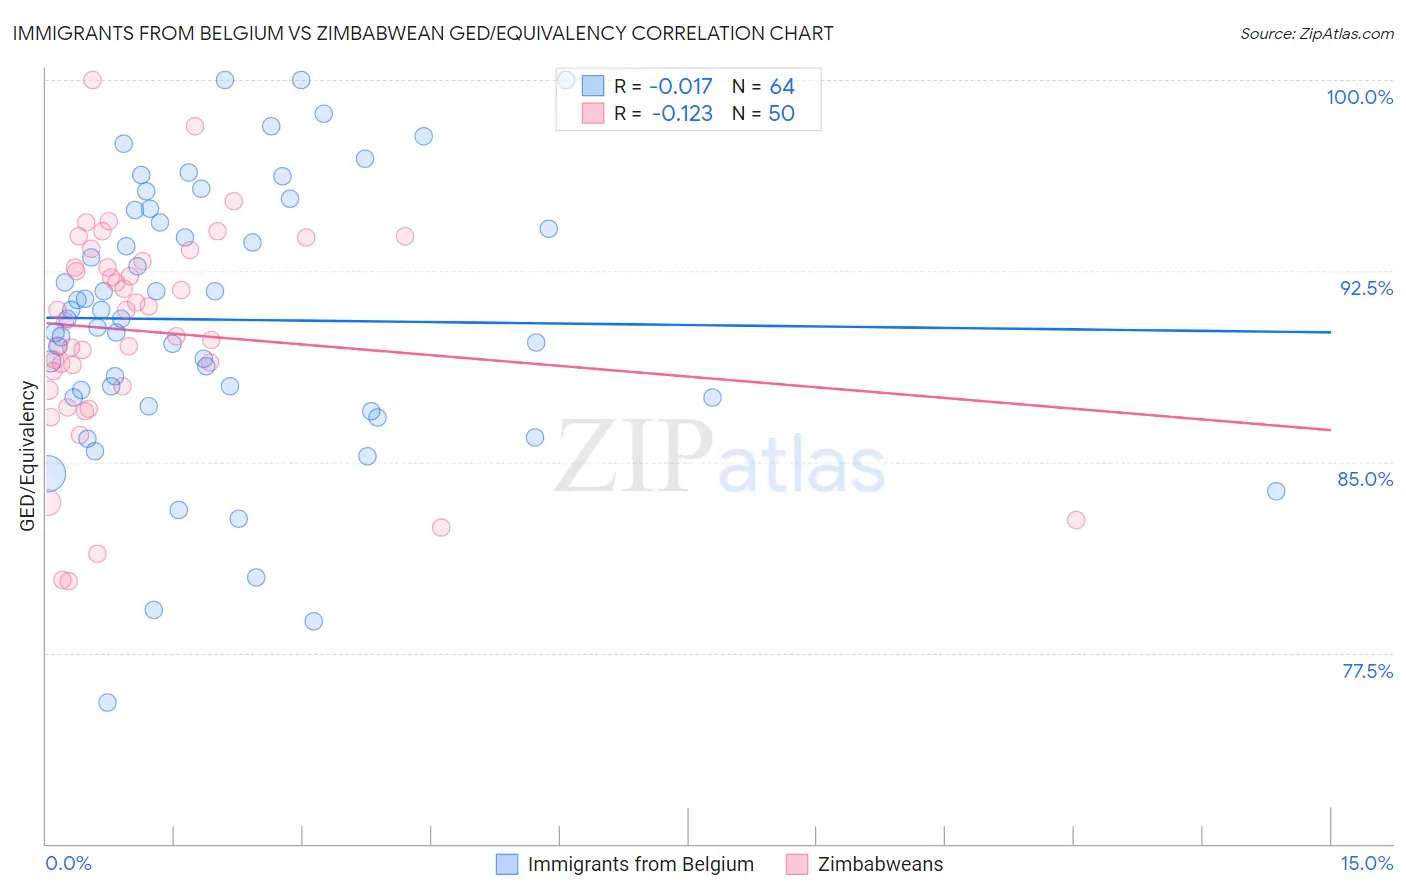
Immigrants from Belgium vs Zimbabwean GED/Equivalency Correlation Chart
The statistical analysis conducted on geographies consisting of 146,727,159 people shows no correlation between the proportion of Immigrants from Belgium and percentage of population with at least ged/equivalency education in the United States with a correlation coefficient (R) of -0.017 and weighted average of 88.3%. Similarly, the statistical analysis conducted on geographies consisting of 69,202,202 people shows a poor negative correlation between the proportion of Zimbabweans and percentage of population with at least ged/equivalency education in the United States with a correlation coefficient (R) of -0.123 and weighted average of 88.0%, a difference of 0.39%.
GED/Equivalency Correlation Summary
| Measurement | Immigrants from Belgium | Zimbabwean |
| Minimum | 75.5% | 80.3% |
| Maximum | 100.0% | 100.0% |
| Range | 24.5% | 19.7% |
| Mean | 90.6% | 90.1% |
| Median | 90.6% | 90.7% |
| Interquartile 25% (IQ1) | 87.5% | 88.0% |
| Interquartile 75% (IQ3) | 94.6% | 92.9% |
| Interquartile Range (IQR) | 7.1% | 4.9% |
| Standard Deviation (Sample) | 5.4% | 4.2% |
| Standard Deviation (Population) | 5.3% | 4.2% |
Demographics Similar to Immigrants from Belgium and Zimbabweans by GED/Equivalency
In terms of ged/equivalency, the demographic groups most similar to Immigrants from Belgium are Immigrants from South Central Asia (88.4%, a difference of 0.020%), Immigrants from Austria (88.3%, a difference of 0.030%), Immigrants from Japan (88.4%, a difference of 0.040%), Burmese (88.3%, a difference of 0.060%), and Immigrants from Israel (88.2%, a difference of 0.15%). Similarly, the demographic groups most similar to Zimbabweans are Immigrants from Netherlands (88.0%, a difference of 0.0%), Immigrants from South Africa (88.0%, a difference of 0.0%), Soviet Union (88.0%, a difference of 0.010%), Immigrants from Korea (88.1%, a difference of 0.050%), and Australian (88.1%, a difference of 0.060%).
| Demographics | Rating | Rank | GED/Equivalency |
| Immigrants | Japan | 99.7 /100 | #34 | Exceptional 88.4% |
| Immigrants | South Central Asia | 99.7 /100 | #35 | Exceptional 88.4% |
| Immigrants | Belgium | 99.7 /100 | #36 | Exceptional 88.3% |
| Immigrants | Austria | 99.7 /100 | #37 | Exceptional 88.3% |
| Burmese | 99.7 /100 | #38 | Exceptional 88.3% |
| Immigrants | Israel | 99.6 /100 | #39 | Exceptional 88.2% |
| Italians | 99.6 /100 | #40 | Exceptional 88.2% |
| Finns | 99.6 /100 | #41 | Exceptional 88.2% |
| Cambodians | 99.6 /100 | #42 | Exceptional 88.2% |
| Immigrants | Scotland | 99.6 /100 | #43 | Exceptional 88.2% |
| Macedonians | 99.5 /100 | #44 | Exceptional 88.1% |
| Czechs | 99.5 /100 | #45 | Exceptional 88.1% |
| Immigrants | Switzerland | 99.5 /100 | #46 | Exceptional 88.1% |
| Immigrants | Latvia | 99.5 /100 | #47 | Exceptional 88.1% |
| Greeks | 99.5 /100 | #48 | Exceptional 88.1% |
| Australians | 99.5 /100 | #49 | Exceptional 88.1% |
| Immigrants | Korea | 99.5 /100 | #50 | Exceptional 88.1% |
| Immigrants | Netherlands | 99.4 /100 | #51 | Exceptional 88.0% |
| Zimbabweans | 99.4 /100 | #52 | Exceptional 88.0% |
| Immigrants | South Africa | 99.4 /100 | #53 | Exceptional 88.0% |
| Soviet Union | 99.4 /100 | #54 | Exceptional 88.0% |